1. Home > 
  2. Stock Photos > 
  3. Futuristic Data Dashboard with Glowing Analytics Visualization

Futuristic Data Dashboard with Glowing Analytics Visualization Image

Futuristic Data Dashboard with Glowing Analytics Visualization

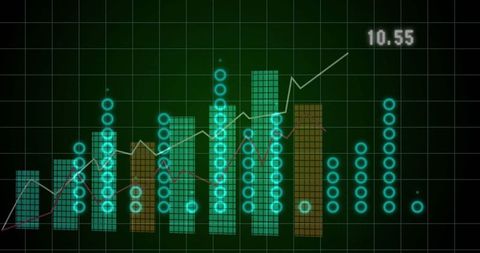
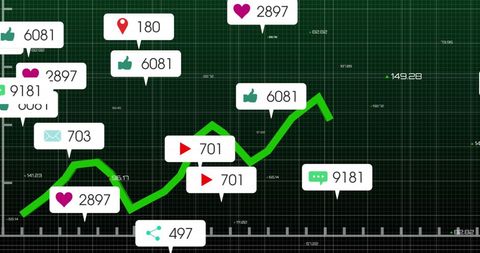
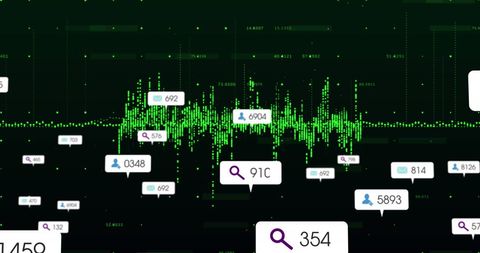
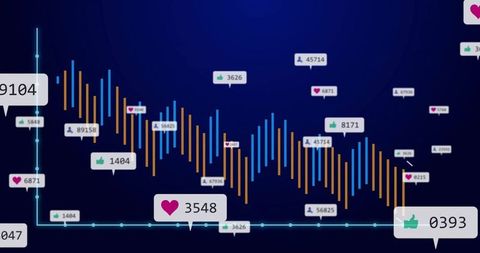
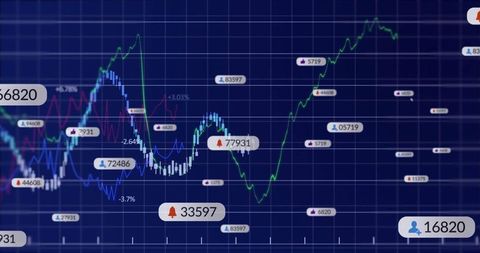
Glowing turquoise circles create dynamic visual representation on grid dashboard, showing data relationships through numeric callouts and icons. Ideal for presentations or articles highlighting modern data analysis, technology advancements, and visualization techniques.

Powered by Shutterstock logo - Get 15% off with code: PIKWIZARD15
Man look at the dashboard with graphs and charts. Concept of data management system, business intelligence, data statistics, marketing analysis, key performance indicators (KPI) and analytics. - Powered by Shutterstock - Get 15% off with code: PIKWIZARD15Businessman using computer for development and Analytics Data technology management System for report marketing strategy planning. graph analysis and information on a futuristic virtual screen. - Powered by Shutterstock - Get 15% off with code: PIKWIZARD15Data analytics automated with AI technology. Big data, business analytics and artificial intelligence automation. Dashboard report with sales and operations charts and KPI insights on touch screen. - Powered by Shutterstock - Get 15% off with code: PIKWIZARD15Data analytics and insights powered by big data and artificial intelligence technologies. Data scientist working with complex information analysed by AI for business analytics dashboard with charts. - Powered by Shutterstock - Get 15% off with code: PIKWIZARD15analyst manages the system database, and analysis data plans, and reports. shows a dashboard chart on the computer. research on platform digital technology. analytics business concept - Powered by Shutterstock - Get 15% off with code: PIKWIZARD15

Credit Photo

If you would like to credit the Photo, here are some ways you can do so

Free (free of charge)

Free for personal and commercial use.

Author: Authentic Images

Similar Free Stock Images

Digital Interface with Scanning and Data Processing Background
Premium
Businessman analysis enterprise data management concept, Businessman analytics dashboard charts marketing, Financial organization strategy, Banking, Long-term business planning, Target, Goal setting
Electric Vehicle Charging Interface and 3D Model Overlay
Geometric Bull Symbol with Digital Grid in Green
Digital Padlock and Grid Overlay on World Map Background
Digital Security and Data Protection Graphic
Premium
Analyst working with Business, Concept digital transformation technology strategy, Analytics and Data Management System on computer, make a report with KPI and metrics connected to database.
Holographic Notification Bars with Dynamic Graph Data
Abstract Graph with Social Media Notification Icons and Data Points
Financial Data Analysis with Graph and Connectivity
Digital Financial Data Processing with Abstract Graph
Premium
Dashboard finance management on laptop computer analyzing sales data and growth graph chart report. Business planning, strategy and development. Financial accounting. market research, data analysis
Stock Market Graph with Social Media Notifications Overlay
Digital Communication Interface with Location and Notifications
Digital Skull with Data Analytics in Cybersecurity Display
Digital Interface with Data Graphs and Media Icons
Premium
Analytics Finance and Business concept. Big data analytics and business intelligence BI.
Futuristic Neon Wireframe Social Interaction Interface
Interactive Data Visualization with Emerging Analytics Trends
Digital Data Analytics Interface with Turquoise Circular Graph
Global Connections Data Analyst Concept Digital Dashboard
Premium
Analyst working with Financial Report and Business Analytics Dashboard on laptop computer to analyze Financial Data with KPI and Metrics. Investment, Operations, Sales, Corporate Finance, Strategy.
Geometric Pig Head on Trading Interface with Social Media Metrics
Digital Dashboard with Notifications and Analytics Icons
Social Media Metrics Dashboard with Interactive Design Elements
Dynamic Data Visualization with Multicolor Line Chart and Metrics
Premium
Hand holding smartphone displays data visualizations, including histogram and pie chart. Analytics, digital transformation and increasing use of mobile technology in business. Minimalist art collage.
Interactive Financial Dashboard with Graphs and Data Labels
Digital Data Visualization on Dark Grid Interface
Futuristic Digital Analytics with Wi-Fi Data Visualization
Digital Threat of Virus on Circuit-like Background
Digital Financial Data Stream with Numeric Overlay
Digital Financial Data and Dynamic Stock Market Graphs
Premium
Data analyst working on business analytics dashboard with charts, metrics and KPI to analyze performance and create insight reports for operations management.
Circuitry and Data Stream on Digital Grid Background
Futuristic Financial Data Visualization
Medical Icons with Cardiograph Digital Interface Concept
Data Analytics and Stock Market Graphs
Premium
Business finance data analytics graph.Financial management technology.Advisor using KPI Dashboard on virtual screen.
Social Media Analytics with Data Processing in Green Theme
Financial Data and Graphs with Futuristic Interface
Dynamic Financial Graphs Illustrating Business Growth
Digital Financial Data Analysis and Stock Market Charting
Premium
KPI Business Analytics Dashboard On Laptop Computer
AI Robots Exchange Digital Conversation in Binary Code
Digital Data Streams and Analytics Visualization
Futuristic Digital Data Visualization with Interactive Graphs
Digital 5G Technology Concept with Geometric Patterns
Premium
Businessman using laptop computer analyzing sales data and financial growth graph chart report. Business planning, strategy and development. Financial accounting. market research, data analysis
Digital Data Analytics Chart with Icons and Labels
Visionary 6G Interface Illustrating Technological Connectivity
Digital Financial Trading Chart with Candlesticks and Data Labels
Data Visualization Dashboard with Interactive Metric Icons
Premium
A high-tech environment featuring a hand interacting with a futuristic transparent touchscreen display, showcasing data analytics and digital visuals for business insights.
Dynamic Line Graph Illustrating Trading Platform Data Trends
Digital Data Visualization with Icons and Graphs on Grid Background
Futuristic Dashboard with Analytics and Social Metrics
Dynamic Line Graph on Green Dashboard with Analytics Icons
Premium
Digital marketing and social media ads, Strategies for online promotion, Targeting customers, and boosting engagement through SEO, AI, and Data, E-commerce and online advertising, Creative tools.
Digital Analytics Dashboard Featuring Data Visualization Elements
Futuristic Digital Interface with Lightbulb and Icons
Displaying neon energy dashboard with glowing cyan bars and teal renewable icons
Digital Data Analysis and Mathematical Overlay
Dynamic Financial Data Analysis Illustration
5G Technology with Digital Cyber Security Elements in Abstract Design
Premium
Businessman using KPI dashboard.Financial business KPI System data analytics graph dashboard.Data System KPI and metrics connected in database for follow earnings,operations and sales data.
Financial Data Analysis with Digital Graph Overlay on Dark Grid
Futuristic Abstract Concept with Cloud and Binary Code
Sustainable Icons Overlay on Financial Data Analysis Concept
Dynamic Notification Interface with Stocks and Social Media Alerts
Premium
African American woman analyzing financial data on laptop screen in hybrid office setting for digital entrepreneurship KPI dashboard.
Futuristic Social Media and Stock Market Interface Design
Visuals Exploring Business Analytics and Digital Connectivity
Global Financial Data Processing with Digital Interface Elements
Dynamic Financial Data Charts and Graphs Background
Premium
Data analytics automated with AI technology. Businessman use laptop and dashboard for Automating Data Management Analytics and Business Reports with KPI. AI chat bot. Database. Sales. Marketing.
Eco Friendly Charging Concept with Digital Battery Icon
6G Cloud Technology Concept with Data Networks and Growth Graphs
Dynamic Financial Data Analytics with Stock Market Trends
Interactive Data Visualization with Metrics and Graphs
Premium
Analyst working with Financial Data and Business Analytics Dashboard on computer to make Financial Report with KPI and Metrics. Investment, Corporate Finance, Strategy, Operations, Sales.
Blockchain Data Analysis with Digital Dashboard Interactive Interface
Global Business Dashboard with Interactive Data Visualizations
Futuristic Digital Interface with Green Neon Icons and Data
Digital Analytics with Social Media Overlay
Premium
KPI Dashboard Data Analytics On Business Laptop
3D Visualization of Analytics Dashboard with Interactive Data
Teal Line Graph with Social Metrics and User Engagement Data
Dynamic Clusters of Social Media Interactions with Digital Interface
Dynamic Analytics Dashboard with Data Points and Callouts
Premium
Big data analytics and business intelligence (BI) concept with chart and graph icons on a digital screen interface and a businessman in background
Futuristic Notification Overlay on Digital Circuit Board
Floating holographic data tags drifting through neon digital space with green lens flare
Digital Communication Icons on Green Starry Background
Abstract Financial Growth and Data Analysis
Dynamic Financial Growth Chart on Digital Screen
Digital Interface with 6G Technology and Media Icons
Premium
Finance analyst working on business analytics and data management system to make financial report with business performance, KPI dashboard. Corporate strategy for finance, digital marketing plan
Social Media Notifications on Stock Market Graph Overlay
Eco Data Visualization with Environmental Icons and Graphs
Social Media Notifications and Growth Chart Dynamics
Futuristic Technology Concept with Global Data Visualization
Premium
Hand Business people touching artificial intelligence AI circuit board to analyze data automated chart graph. Innovative technology Machine learning on virtual screen for futuristic.
Futuristic Business Technology Interface with Graphs and Icons
Digital Financial Data with Graphs and Numbers Illustrations
Futuristic Cloud Data Visualization with Digital Processing Concept
Dynamic Financial Data Analysis with Growth Indicators
Premium
Businessman analyzing a business analytics (BA) or intelligence (BI) dashboard on virtual screen showing sales and operations data statistics charts and key performance indicators (KPI)
Economic Impact of Rising Sea Levels and Climate Change
Wireframe Sports Car with Notification Icons in Digital Space
Futuristic Polygonal Bull with Social Media Analytics Data
Dynamic Financial Data Graph Illustrating Stock Market Trends
Premium
An analyst uses a computer and dashboard for data business analysis and Data Management System with KPI and metrics connected to the database for technology finance, operations, sales, marketing
Interactive Dashboard with Stock Candlestick Chart and Social Engagement
Futuristic Digital Interface with Floating Notifications and Analytics
Futuristic Data Visualization with Bar Chart and Digital Metrics
Social Media Metrics Dashboard with Interactive Graphs
Premium
A businessman uses a laptop to access an AI-powered business analytics dashboard, showcasing charts, metrics, and KPIs. He analyzes performance data to generate. Data analysis concept.
Digital Currency Uptrend in Futuristic Virtual Grid
Dynamic Trading Dashboard on Digital Blue Grid Display
Digital Dashboard with Financial Metrics and Social Notifications
Financial Trading Dashboard with Rising Chart and Notifications
Premium
Analyst working with Business Analytics and Data Management System on computer to make report with KPI and metrics connected to database. Corporate strategy for finance, operations, sales, marketing
Displaying Floating Data Callouts with Search, User and Message Metrics in Futuristic HUD