
- Home >
- Stock Photos >
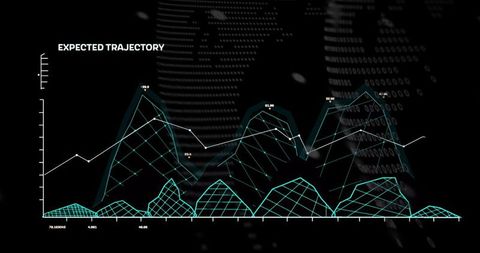
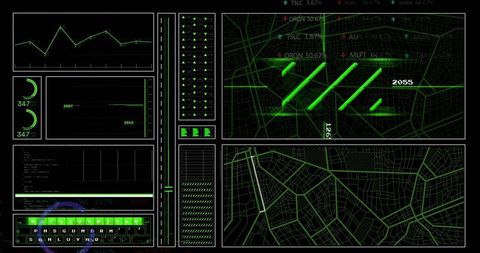
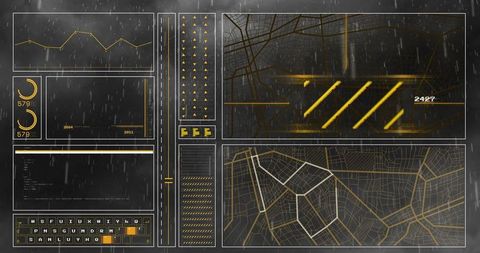
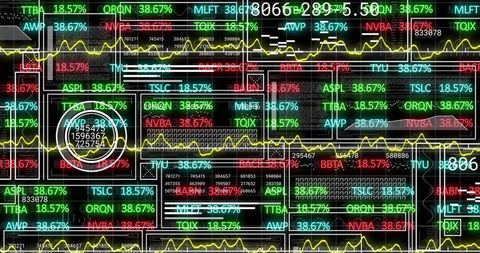
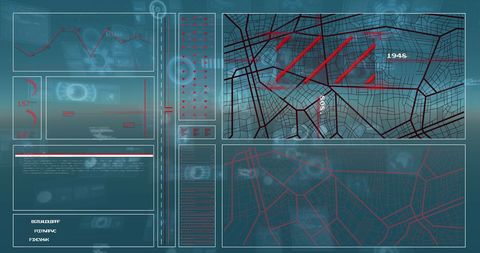
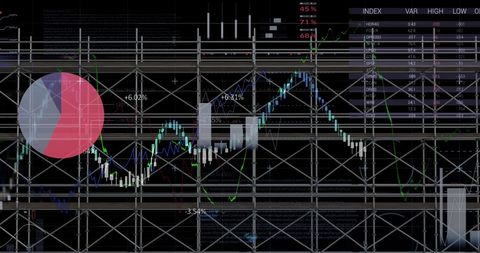
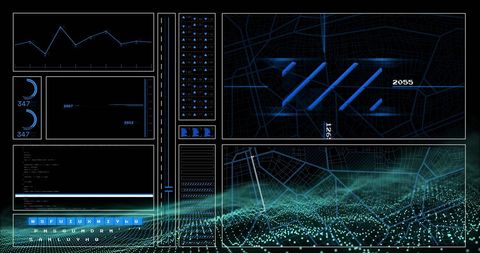
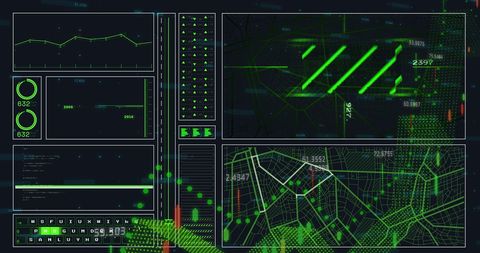
- Futuristic Data Dashboard with Graphs and Maps
Futuristic Data Dashboard with Graphs and Maps Image
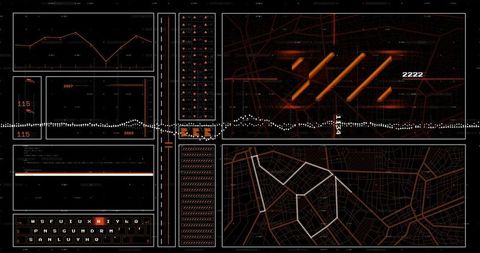
Visual showcases a high-tech data dashboard theme with line graphs, 3D bars, and interactive elements. Represents concept of a command center interface blending analytics tools, visual data patterns, and surveillance features. Ideal for projects focusing on analytics software, technological advancements, IT infrastructure, or cyber interfaces. Useful for presentations on data visualization, tech workshops, or illustrating intelligent system functions.
Powered by 


downloads
Tags:
More
Credit Photo
If you would like to credit the Photo, here are some ways you can do so
Text Link
photo Link
<span class="text-link">
<span>
<a target="_blank" href=https://pikwizard.com/photo/futuristic-data-dashboard-with-graphs-and-maps/c21969773076f3636e5e881b040bb4a4/>PikWizard</a>
</span>
</span>
<span class="image-link">
<span
style="margin: 0 0 20px 0; display: inline-block; vertical-align: middle; width: 100%;"
>
<a
target="_blank"
href="https://pikwizard.com/photo/futuristic-data-dashboard-with-graphs-and-maps/c21969773076f3636e5e881b040bb4a4/"
style="text-decoration: none; font-size: 10px; margin: 0;"
>
<img src="https://pikwizard.com/pw/medium/c21969773076f3636e5e881b040bb4a4.jpg" style="margin: 0; width: 100%;" alt="" />
<p style="font-size: 12px; margin: 0;">PikWizard</p>
</a>
</span>
</span>
Free (free of charge)
Free for personal and commercial use.
Author: Awesome Content
Similar Free Stock Images

Premium


Premium


Premium

Premium


Premium


Premium


Premium


Premium

Premium


Premium

Premium


Premium


Premium


Premium


Premium

Premium


Premium


Premium


Premium


Premium


Premium


Premium

Premium

Premium


Premium

Explore More Free Stock Images