1. Home > 
  2. Stock Photos > 
  3. Futuristic Data Dashboard with Neon 3D Visualizations

Futuristic Data Dashboard with Neon 3D Visualizations Image

Futuristic Data Dashboard with Neon 3D Visualizations

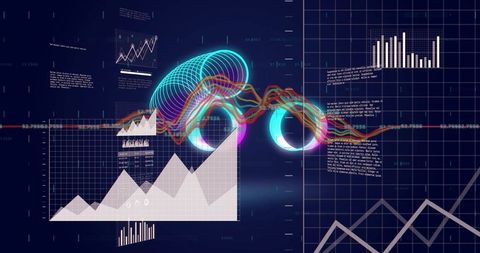
This vibrant scene captures the dynamic flow of data visualizations in a high-tech digital interface. Neon torus and waveform elements impressed within area and bar charts suggest advanced analytics and trend monitoring, suitable for presentations and promotions in technology industries. Useful for tech companies showcasing innovative data solutions, or digital media realizing insights through futuristic design.

Powered by Shutterstock logo - Get 15% off with code: PIKWIZARD15
Displaying overlay on dark blur, showing bar line and pie placeholders with % labels. Technology, data, analytics, interface, innovation, futurism, dashboard - Powered by Shutterstock - Get 15% off with code: PIKWIZARD15Displaying analytics dashboard on screen with grid lines, bar and pie charts, swirling data streams. Futuristic, digital, technology, data, abstract, visualization, neon - Powered by Shutterstock - Get 15% off with code: PIKWIZARD15Displaying green line graph zigzagging in trading interface with binary digits and numeric labels. Finance, data visualization, technology, analytics, digital, futuristic, business - Powered by Shutterstock - Get 15% off with code: PIKWIZARD15Multiple hands interacting with digital business dashboard featuring real-time analytics, data visualization, and futuristic glowing interface. Concept of business, technologies, data, engineering. Ad - Powered by Shutterstock - Get 15% off with code: PIKWIZARD15Business man with laptop tracking bitcoin mining progress in purple holographic UI. Concept of blockchain interface, crypto apps, mining dashboards, fintech data systems. - Powered by Shutterstock - Get 15% off with code: PIKWIZARD15

Credit Photo

If you would like to credit the Photo, here are some ways you can do so

Free (free of charge)

Free for personal and commercial use.

Author: Awesome Content

Similar Free Stock Images

Global Data Analytics and Network Visualization on Digital Grid
Premium
Rendering market display on dark navy screen showing world map, dotted peaks, candles, lit labels. Candlestick, glyphs, visualization, dashboard, neon, grid, futuristic
Financial Charts with Blue and Red Lines and Digital Percent Indicators
Premium
Hand interacting with virtual tablet interface showing graphs, global map, and AI bot icon, neon purple-blue background, fintech concept
Premium
Displaying white-outlined panel showing neon green spikes on grid backdrop, with numeric overlays. Technology, data visualization, analytics, digital interface, financial, neon, futuristic
Financial Data Analytics in Digital Interface Design
Global Finance and Economy Interface with Digital Graphs
Economic Decline Illustrated with Chart and Red Arrow
Data Processing Overlaid on Graphs and Code in Digital Interface
Futuristic Financial Data Interface with Graphs and Binary Code
Digital Financial Data and Statistics Analyzing Concept
Abstract Digital Financial Data Graph Chart
Digital Trading Dashboard with Dynamic Candlestick Charts
Financial Data Analysis with Graphs and Charts on Abstract Grid
Dynamic Stock Market Graphics on Modern Digital Interface
Financial Data Graphic with Rising Trends on Digital Grid
Premium
Metaverse digital cyber world technology concept. virtual digital dashboard interface The real world virtual
Premium
Displaying pair of semi-transparent green pie charts occupying center of HUD, with map tags. Dashboard, analytics, data, neon, teal, interface, futuristic
Dynamic Financial Data Trends with Fluctuating Graphs and Charts
Futuristic Data Analytics in a Virtual 3D Grid Display
Futuristic Digital Financial Analysis with City Background
Advanced Digital Data Analytics and Visualization Dashboard
Premium
Displaying network dashboard on glass panel, showing user nodes, dashed arrows, three trend lines. Visualization, analytics, data, urban, cityscape, neon, futuristic
Financial analytics dashboard showing charts, pie visualization and market trend signals
Futuristic Digital Interface with City Overlay and Data Graphs
Stock Market Data Visuals Displaying Financial Analysis Trends
Finance and Technology Theme with Stock Market Data Overlay
Financial Data Charts with Viewing Grid in Dark Perspective
Realtime Fintech Analytics Dashboard with Interactive Line Charts and Social Badges
Digital Dashboard With Candlestick Bar and Line Graph Interface
Stock Market Analysis Digital Screen with Graphs and Trends
Premium
Displaying green data dashboard showing bar charts, neon line graph, numeric readouts on screen. Futuristic, digital, technology, analytics, network, interface, neon
3D Financial Chart with Candlestick Bars and Trend Lines
Futuristic Data Screens Showing Business Analytics and Growth Trends
Digital Financial Graphs and Market Data Analysis
Digital Data Graph with Code Interface on Blue Background
Dynamic Financial Charts with Blue Digital Interface
Financial Data Overlay on Environmental Pollution Concept
Premium
A high-quality futuristic data dashboard concept featuring hands typing on a laptop with floating pie charts, bar graphs, progress circles, and analytics UI elements. Ideal for illustrating
Futuristic Waveform Display on Virtual Trading Dashboard
Financial Data Visualization with Digital World Map and Graphs
Premium
Experience Advanced Corporate Data Analysis With Professional Interactive Holographic Display, Showcasing Key Performance Indicators And Digital Line Graphs Using Cutting edge Technology
Digital Financial Analytics Dashboard with Trend Indicators
Futuristic HUD Interface for Data Analysis and Finance
Digital Financial Data Processing Interface with Graphs and Codes
Analyzing Financial Data with Global Trends and Charts
Premium
Projecting holographic data dashboard floating over data center, showing charts, gauges, rack LEDs. Server, room, cabinets, cabling, neon, glow, futuristic
Futuristic Data Interface with Colorful Digital Lines
Colorful Line Graph on Digital Analytics Interface
Data Processing Over Digital Network Interface
Digital Interface with Financial Data Analytics and Graphs
Premium
Displaying data dashboard centered on screen showing candlestick bars, orange line, speech tags. Visualization, presentation, realtime, neon, futuristic, analytics, metrics
Futuristic Bitcoin 3D Symbol on Dynamic Trading Screen
Futuristic Cyberpunk Interface with Data Visualization Dashboard
Financial Analytics Dashboard with Growth Trends and Indicators
Digital Data Interface with Global Financial Statistics
Premium
Animating center dotted wave pulsing across data display with dotted grid numbers, streaks, specks. Futuristic, analytics, dashboard, neon, gradient, teal, purple
Abstract Financial Chart with Growing Cryptocurrency Trends
Stock Market Trends and Data Analysis over Digital Grid
Analytics Dashboard with Dynamic Financial Data Visualization
Data Processing Overlay on Map of Europe Financial Concept
Premium
Displaying holographic circular HUD floating over data center, with concentric rings, grid overlay. Futuristic, analytics, interface, dashboard, servers, workstation, neon
Digital Financial Data Stream with Numeric Overlay
Digital Graph and Data Analysis with Financial Growth Trends
Dynamic Digital Interface Displaying Financial Data Analysis
Premium
Hands holding virtual financial screen with graphs, charts, and AI bot on blue neon background. Concept of fintech and online trading
Abstract Financial Growth Chart with Rising Bars and Line Graphs
Dynamic Data Analytics Interface Showing Statistical Trends
Futuristic Financial Data with Spinning Digital Globe
Digital Data Visualization with Spinning Globe and Blue Grid
Premium
A futuristic control room with multiple screens displaying data and charts, illuminated by vibrant blue and orange lights, creating a high-tech atmosphere.
Premium
Showing financial interface with holographic circular element and live market data on grid backdrop. Technology, innovation, analytics, visualization, digital, finance, futuristic
Digital Data Interface with Analyzing System Graphs
Financial Data Analysis Graph with Growing Trends
Global Financial Data Processing with Graphs and Charts on Dark Background
Displaying interactive data visualization dashboard with glowing pie chart and analytics
Financial Data Analysis Dashboard with Charts and World Map
Digital Data Visualization Overlaying Sports Stadium
Futuristic Digital Finance Dashboard with Charts and Tickers
Statistical Data and Trends Over Digital Grid Overlay
Digital Finance Technology with Global Interconnection
Financial Data Analytics on Digital Interface
Dynamic Financial Data Analytics with Stock Market Trends
Dynamic Financial Data and Graphs on Digital Interface
Premium
Displaying holographic data panels in 3D command hub, showing radar HUD, chart, globe. Futuristic, dashboard, screens, lattice, visualization, neon, circuits
Technology and Science Analytics with Dashboard Visualization
Digital Data Visualization Over Urban Skyline Concept
Futuristic Financial Charts Over Night Urban Skyline
Digital Data Processing Overlay with Graphs and Charts
Premium
Tablet, hologram and overlay with a black woman in studio on a neon background for biometrics on a dashboard. Futuristic, digital and ai with a person using a holographic or virtual user interface
Digital Stock Market Analysis with Falling Trend Arrow
Premium
Glowing holographic circular HUD pulsing across data dashboard, with neon traces, green server LEDs. Radar, interface, circuitry, grid, map, visualization, telemetry
Digital Data Analysis with Futuristic Charts
Analyzing Statistical Data Over Digital Network With Cityscape
Futuristic Data Visualization with Dynamic Graphs
Financial Data Analytics Over Urban Skyline Concept
Abstract Financial Data Chart with Light Trails
Financial Data Over Grid Indicating Market Trends and Analytics
Selective Data Points on Dark Analytics Dashboard with Sleek Design
Dynamic Financial Data with Global Connections and Insights
Abstract Digital Data Charts Graphs on Dark Grid Background
Dynamic Financial Data and Stock Market Interface
Global Financial Dashboard with Red Downward Trend Line Graph
Dynamic Financial Data Charts on Dark Digital Background
Analytics Dashboard with Trend Lines and Code Snippets
Premium
Tablet, hologram and overlay with a black woman in studio on a neon background for an ai icon on a dashboard. Futuristic, digital and ai with a person using a holographic or 3d virtual user interface
Premium
Businessman holding a device, viewing financial graphs, charts, and data on a futuristic neon display. Concept of fintech and trading interface
Premium
Displaying world map overlaying virtual grid with glowing nodes, circuit lines and numeric overlays. Technology, innovation, abstraction, data visualization, cybersecurity, digital interface, futurism
Digital Financial Data Display with Graphs and Analytics
Digital Interface Displaying Data Processing Analytics on Black Background
FinTech Global Data Chart with Statistical Analysis
Futuristic Digital World Map with Data Waves and Code Patterns
Premium
Showing doctor wearing white lab coat and stethoscope presenting clinical data in clinic with UI. Holographic, neon, futuristic, telemedicine, dashboards, analytics, healthcare
Dynamic Financial Graphs and Dashboard Analytics
Neon Candlestick Chart with Codes and Data Visualization Concept
Futuristic Digital Landscape with Data Visualization and Code
Colorful Graph Analysis in Digital Interface Over Blue Background
Premium
Sweeping multicolored curved code ribbons traversing dark console display with terminal logs. Data, visualization, dashboard, neon, glow, overlay, streams
Global Financial Data and Graphs Over Digital Globe Interface
Digital Financial Data Graph with Winter Snowflake Theme
Dynamic Financial Data Graph Illustrating Stock Market Trends
Premium
Displaying energy data interface at control station, with world map, charts, overlays and icons. Futuristic, technology, dashboard, data visualization, digital, analytics, neon
Abstract Digital Finance Graph Interface Display
Futuristic Data Analysis with Digital Charts and Code
Global Data Visualization and Analytics Dashboard Concept
Explore More Free Stock Images