
- Home >
- Stock Photos >
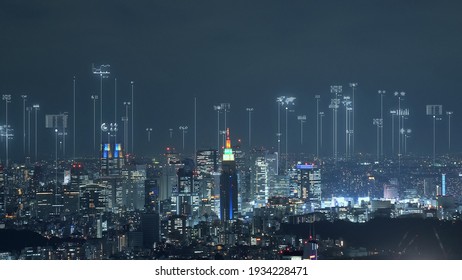
- Futuristic Data Graph Overlay on Urban Cityscape
Futuristic Data Graph Overlay on Urban Cityscape Image

This digital conceptual artwork depicts a futuristic data graph overlay on an urban cityscape. Ideal for presentations on global business trends, technological advancements, and digital data analysis. Use in marketing materials, blogs, or articles focusing on city development, smart cities, or innovative tech solutions.
Powered by  - Get 15% off with code: PIKWIZARD15


downloads
Tags:
More
Credit Photo
If you would like to credit the Photo, here are some ways you can do so
Text Link
photo Link
<span class="text-link">
<span>
<a target="_blank" href=https://pikwizard.com/photo/futuristic-data-graph-overlay-on-urban-cityscape/90bd008e53bf40261ac85191db254ad1/>PikWizard</a>
</span>
</span>
<span class="image-link">
<span
style="margin: 0 0 20px 0; display: inline-block; vertical-align: middle; width: 100%;"
>
<a
target="_blank"
href="https://pikwizard.com/photo/futuristic-data-graph-overlay-on-urban-cityscape/90bd008e53bf40261ac85191db254ad1/"
style="text-decoration: none; font-size: 10px; margin: 0;"
>
<img src="https://pikwizard.com/pw/medium/90bd008e53bf40261ac85191db254ad1.jpg" style="margin: 0; width: 100%;" alt="" />
<p style="font-size: 12px; margin: 0;">PikWizard</p>
</a>
</span>
</span>
Free (free of charge)
Free for personal and commercial use.
Author: Creative Art
Similar Free Stock Images
Loading...

Premium


Premium


Premium
Premium


Premium


Premium


Premium

Premium


Premium


Premium


Premium


Premium


Premium


Premium


Premium

Premium


Premium

Premium

Premium

Premium


Premium


Premium


Premium

Premium


Premium


