- Home >
- Stock Photos >
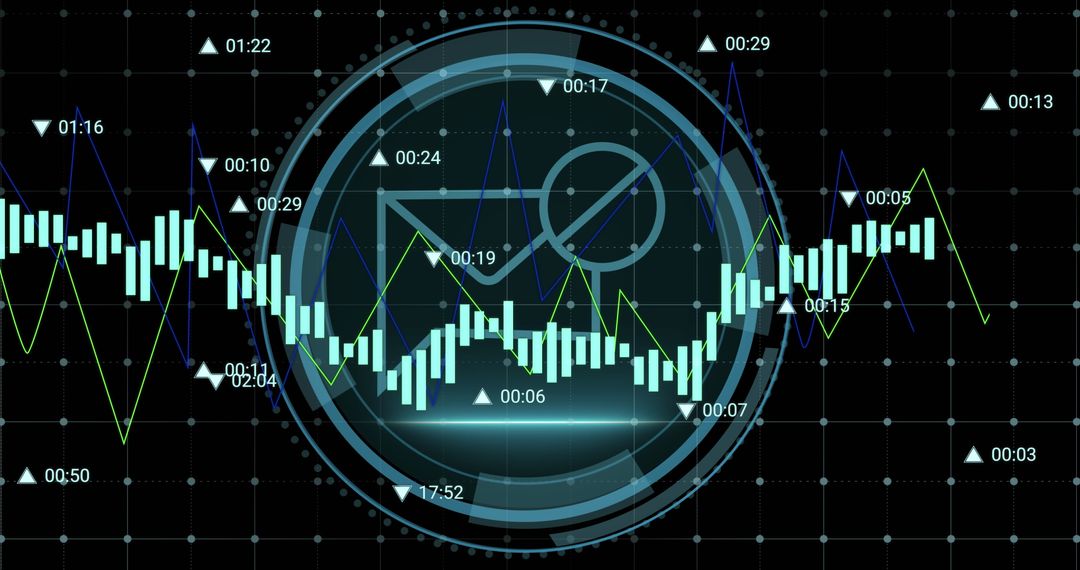
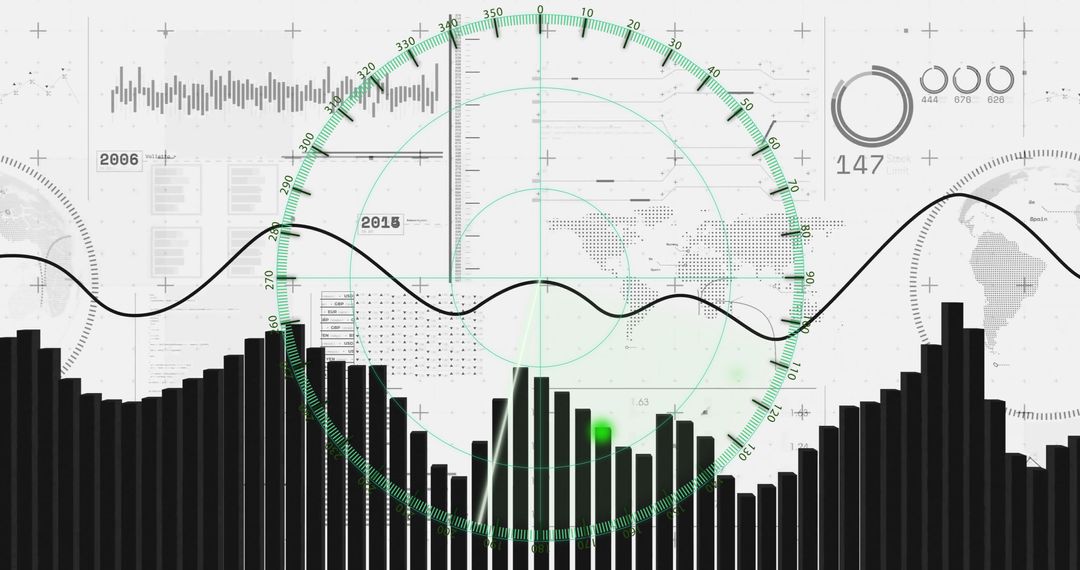
- Futuristic Data HUD Displaying Circular Analytics Overlay and Neon Waveform Charts
Futuristic Data HUD Displaying Circular Analytics Overlay and Neon Waveform Charts Image

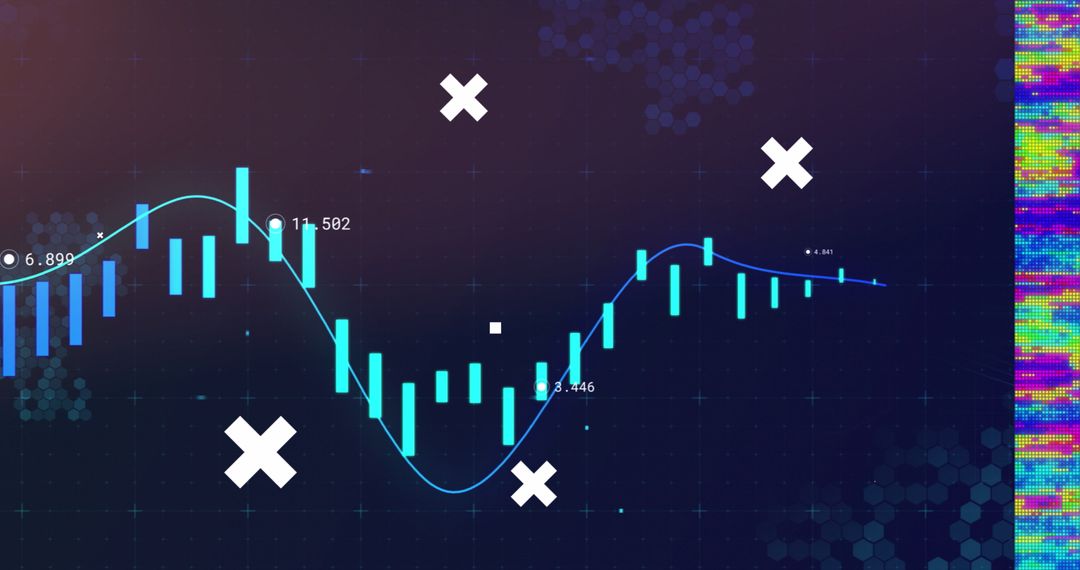
Displaying central circular HUD overlay with concentric rings, numeric readouts, crop brackets, and radial tick marks, layered over multicolored vertical columns and sinusoidal waveform lines on dark navy background. Featuring neon blue, green, magenta and muted gold palette for high-contrast tech look. Ideal for fintech presentations, data science reports, dashboard mockups, UI hero banners, marketing materials for analytics tools, and social media posts promoting metrics or trading platforms. Providing space for headline and overlay text, supporting cropping for banners and widescreen layouts. Delivering modern, abstract visual cue for topics such as data analysis, stock market, machine learning, signal processing, and business intelligence.
Powered by 


0
downloads
downloads
Tags:
More
Credit Photo
If you would like to credit the Photo, here are some ways you can do so
Text Link
photo Link
<span class="text-link">
<span>
<a target="_blank" href=https://pikwizard.com/photo/futuristic-data-hud-displaying-circular-analytics-overlay-and-neon-waveform-charts/a2da51371e1608bc539228d7b8743e55/>PikWizard</a>
</span>
</span>
<span class="image-link">
<span
style="margin: 0 0 20px 0; display: inline-block; vertical-align: middle; width: 100%;"
>
<a
target="_blank"
href="https://pikwizard.com/photo/futuristic-data-hud-displaying-circular-analytics-overlay-and-neon-waveform-charts/a2da51371e1608bc539228d7b8743e55/"
style="text-decoration: none; font-size: 10px; margin: 0;"
>
<img src="https://pikwizard.com/pw/medium/a2da51371e1608bc539228d7b8743e55.jpg" style="margin: 0; width: 100%;" alt="" />
<p style="font-size: 12px; margin: 0;">PikWizard</p>
</a>
</span>
</span>
Free (free of charge)
Free for personal and commercial use.
Author: People Creations
Similar Free Stock Images

Premium


Premium


Premium


Premium


Premium


Premium


Premium


Premium


Premium


Premium


Premium


Premium


Premium


Premium


Premium


Premium


Premium


Premium


Premium


Premium


Premium


Premium


Premium


Premium