
- Home >
- Stock Photos >
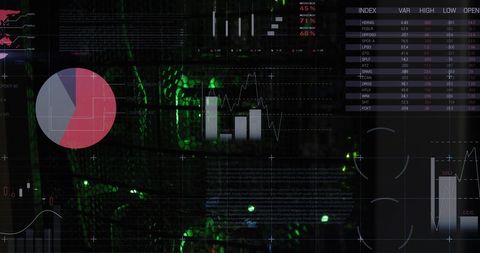
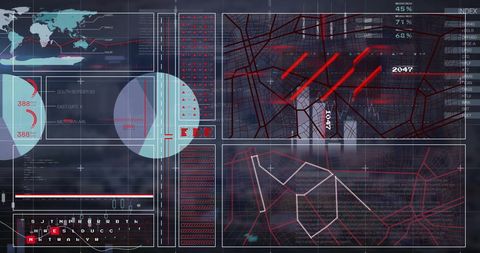
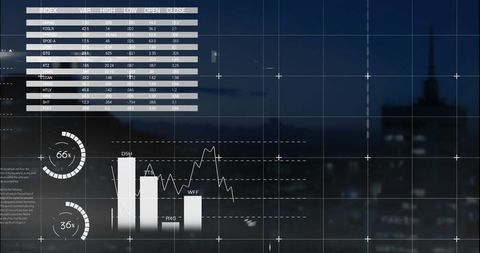
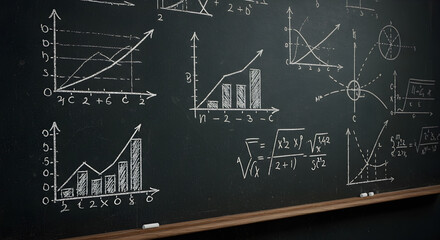
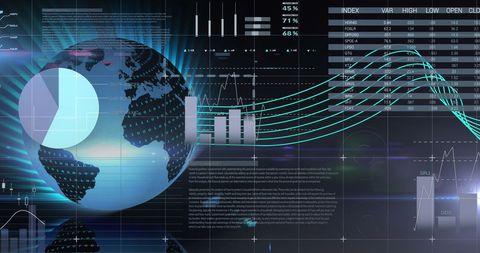
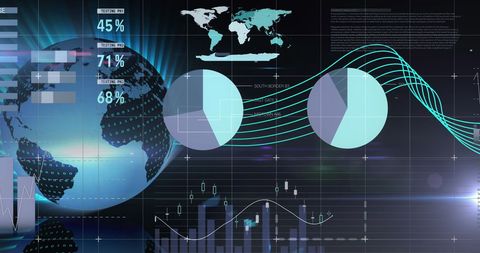
- Futuristic Data Interface and Mathematical Analysis Concept
Futuristic Data Interface and Mathematical Analysis Concept Image

Depicts electronic data with mathematical equations floating over graph visualizations in a high-tech media format. Useful for business intelligence articles, tech-related content, and digital transformation concepts embracing futurism and data processing.
Powered by 


downloads
Tags:
More
Credit Photo
If you would like to credit the Photo, here are some ways you can do so
Text Link
photo Link
<span class="text-link">
<span>
<a target="_blank" href=https://pikwizard.com/photo/futuristic-data-interface-and-mathematical-analysis-concept/8ca480888d5491fba3e60b9546392764/>PikWizard</a>
</span>
</span>
<span class="image-link">
<span
style="margin: 0 0 20px 0; display: inline-block; vertical-align: middle; width: 100%;"
>
<a
target="_blank"
href="https://pikwizard.com/photo/futuristic-data-interface-and-mathematical-analysis-concept/8ca480888d5491fba3e60b9546392764/"
style="text-decoration: none; font-size: 10px; margin: 0;"
>
<img src="https://pikwizard.com/pw/medium/8ca480888d5491fba3e60b9546392764.jpg" style="margin: 0; width: 100%;" alt="" />
<p style="font-size: 12px; margin: 0;">PikWizard</p>
</a>
</span>
</span>
Free (free of charge)
Free for personal and commercial use.
Author: Awesome Content
Similar Free Stock Images

Premium


Premium


Premium

Premium


Premium


Premium


Premium


Premium

Premium


Premium


Premium


Premium

Premium


Premium


Premium

Premium


Premium


Premium

Premium


Premium
Premium


Premium


Premium

Premium


Premium

Explore More Free Stock Images