
- Home >
- Stock Photos >
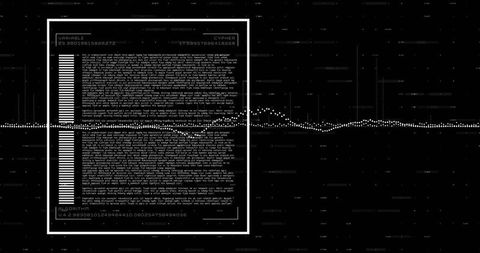
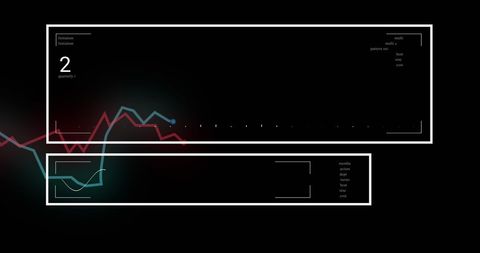
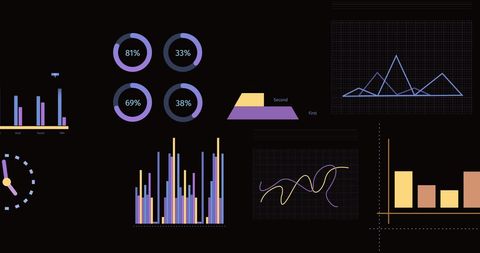
- Futuristic Data Interface with Graphs on Black Background
Futuristic Data Interface with Graphs on Black Background Image
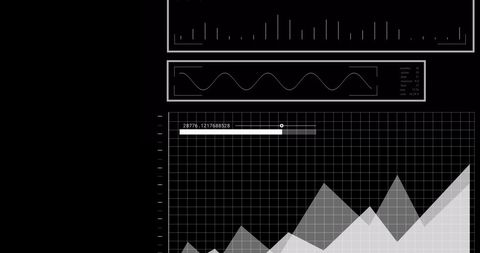
Complex digital interface showcasing data processing with dynamic graphs and charts on a black background. Represents advanced technology in business analysis and computing. Ideal for illustrating modern concepts in data management, technological innovations, and global business operations.
Powered by  - Get 15% off with code: PIKWIZARD15


downloads
Tags:
More
Credit Photo
If you would like to credit the Photo, here are some ways you can do so
Text Link
photo Link
<span class="text-link">
<span>
<a target="_blank" href=https://pikwizard.com/photo/futuristic-data-interface-with-graphs-on-black-background/a3c46af3b4a6b02370f084744941659d/>PikWizard</a>
</span>
</span>
<span class="image-link">
<span
style="margin: 0 0 20px 0; display: inline-block; vertical-align: middle; width: 100%;"
>
<a
target="_blank"
href="https://pikwizard.com/photo/futuristic-data-interface-with-graphs-on-black-background/a3c46af3b4a6b02370f084744941659d/"
style="text-decoration: none; font-size: 10px; margin: 0;"
>
<img src="https://pikwizard.com/pw/medium/a3c46af3b4a6b02370f084744941659d.jpg" style="margin: 0; width: 100%;" alt="" />
<p style="font-size: 12px; margin: 0;">PikWizard</p>
</a>
</span>
</span>
Free (free of charge)
Free for personal and commercial use.
Author: Awesome Content
Similar Free Stock Images

Premium


Premium


Premium


Premium


Premium


Premium


Premium


Premium

Premium

Premium


Premium


Premium


Premium

Premium


Premium

Premium


Premium


Premium


Premium


Premium


Premium


Premium


Premium


Premium


Premium


Explore More Free Stock Images