
- Home >
- Stock Photos >
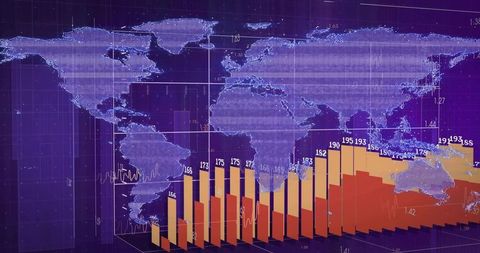
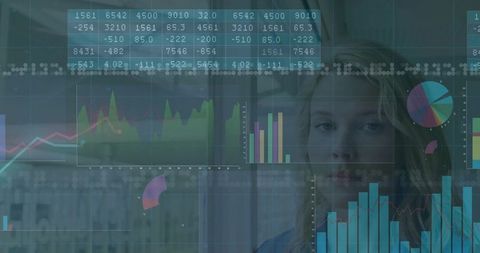
- Futuristic Data Processing Concept with Graphs and Charts
Futuristic Data Processing Concept with Graphs and Charts Image
Depicts digital data analytics with overlapping graphs and bar charts on blue background. Ideal for use in presentations, websites, or articles focused on finance, business growth, or digital technology. Useful for emphasizing data-driven decision-making and future market trends.
Powered by 


downloads
Tags:
More
Credit Photo
If you would like to credit the Photo, here are some ways you can do so
Text Link
photo Link
<span class="text-link">
<span>
<a target="_blank" href=https://pikwizard.com/photo/futuristic-data-processing-concept-with-graphs-and-charts/11b0e1ba48c32e7484cf1eb72a466039/>PikWizard</a>
</span>
</span>
<span class="image-link">
<span
style="margin: 0 0 20px 0; display: inline-block; vertical-align: middle; width: 100%;"
>
<a
target="_blank"
href="https://pikwizard.com/photo/futuristic-data-processing-concept-with-graphs-and-charts/11b0e1ba48c32e7484cf1eb72a466039/"
style="text-decoration: none; font-size: 10px; margin: 0;"
>
<img src="https://pikwizard.com/pw/medium/11b0e1ba48c32e7484cf1eb72a466039.jpg" style="margin: 0; width: 100%;" alt="" />
<p style="font-size: 12px; margin: 0;">PikWizard</p>
</a>
</span>
</span>
Free (free of charge)
Free for personal and commercial use.
Author: Awesome Content
Similar Free Stock Images

Premium


Premium

Premium


Premium


Premium


Premium


Premium


Premium


Premium


Premium


Premium


Premium


Premium


Premium


Premium


Premium


Premium


Premium

Premium


Premium


Premium


Premium


Premium

Premium

Premium

Explore More Free Stock Images