
- Home >
- Stock Photos >
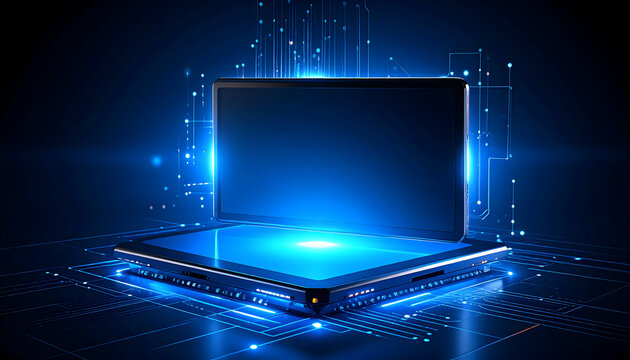
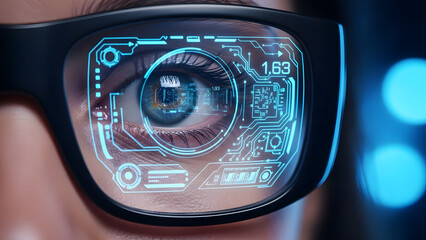
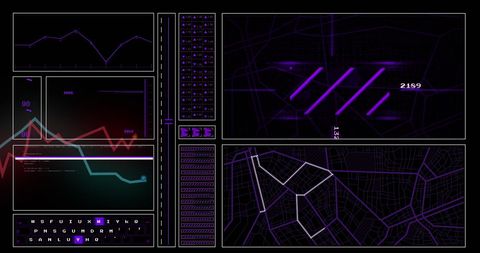
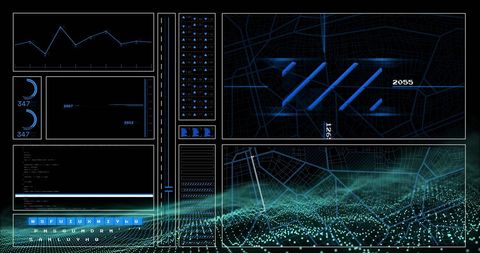
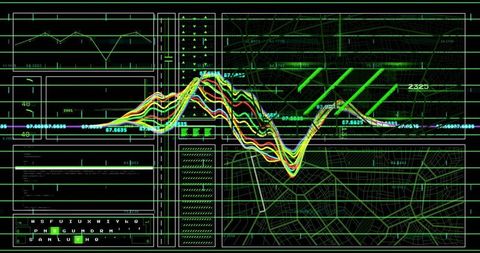
- Futuristic Data Processing Interface on Blue Background
Futuristic Data Processing Interface on Blue Background Image

Digital design showcasing a high-tech data processing interface filled with graphs and analytic tools. Perfect for illustrating themes of business analytics, data science, and technology in digital settings.
Powered by 


downloads
Tags:
More
Credit Photo
If you would like to credit the Photo, here are some ways you can do so
Text Link
photo Link
<span class="text-link">
<span>
<a target="_blank" href=https://pikwizard.com/photo/futuristic-data-processing-interface-on-blue-background/cfe4c2ebdb77fd3c166c99b2a22c3913/>PikWizard</a>
</span>
</span>
<span class="image-link">
<span
style="margin: 0 0 20px 0; display: inline-block; vertical-align: middle; width: 100%;"
>
<a
target="_blank"
href="https://pikwizard.com/photo/futuristic-data-processing-interface-on-blue-background/cfe4c2ebdb77fd3c166c99b2a22c3913/"
style="text-decoration: none; font-size: 10px; margin: 0;"
>
<img src="https://pikwizard.com/pw/medium/cfe4c2ebdb77fd3c166c99b2a22c3913.jpg" style="margin: 0; width: 100%;" alt="" />
<p style="font-size: 12px; margin: 0;">PikWizard</p>
</a>
</span>
</span>
Free (free of charge)
Free for personal and commercial use.
Author: People Creations
Similar Free Stock Images

Premium


Premium

Premium


Premium


Premium


Premium


Premium

Premium

Premium


Premium


Premium

Premium


Premium


Premium


Premium


Premium


Premium


Premium


Premium


Premium


Premium


Premium

Premium


Premium

Premium


Explore More Free Stock Images