- Home >
- Stock Photos >
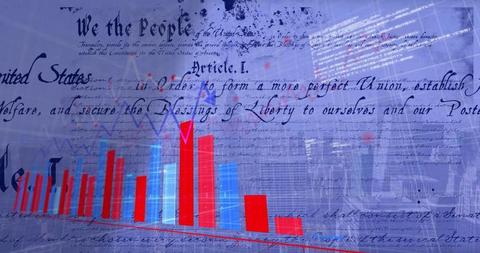
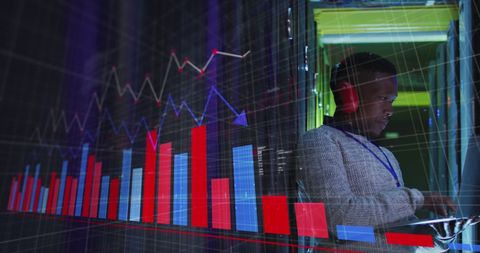
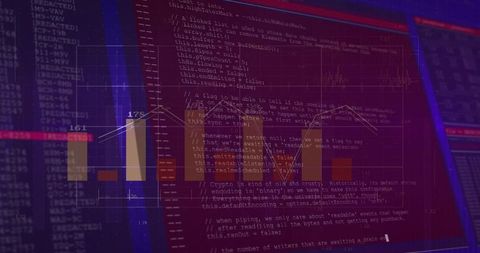
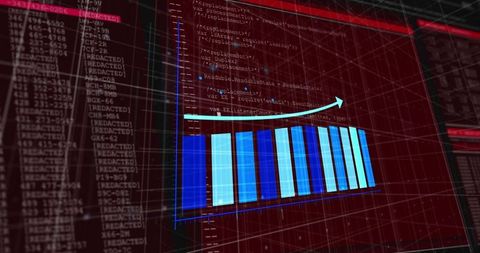
- Futuristic Data Processing with Bar Graph and Digital Interface
Futuristic Data Processing with Bar Graph and Digital Interface Image

This abstract concept art of data processing showcases bar graphs and digital code overlaying a blue and red-toned cityscape. Ideal for illustrating global technology trends, digital analytics, or virtual marketing processes. Use in presentations, websites, or articles focused on business, tech innovations, or data science.

downloads
Tags:
More
Credit Photo
If you would like to credit the Photo, here are some ways you can do so
Text Link
photo Link
<span class="text-link">
<span>
<a target="_blank" href=https://pikwizard.com/photo/futuristic-data-processing-with-bar-graph-and-digital-interface/0089337fb3b77ea6f21bedf4ba8ebd3e/>PikWizard</a>
</span>
</span>
<span class="image-link">
<span
style="margin: 0 0 20px 0; display: inline-block; vertical-align: middle; width: 100%;"
>
<a
target="_blank"
href="https://pikwizard.com/photo/futuristic-data-processing-with-bar-graph-and-digital-interface/0089337fb3b77ea6f21bedf4ba8ebd3e/"
style="text-decoration: none; font-size: 10px; margin: 0;"
>
<img src="https://pikwizard.com/pw/medium/0089337fb3b77ea6f21bedf4ba8ebd3e.jpg" style="margin: 0; width: 100%;" alt="" />
<p style="font-size: 12px; margin: 0;">PikWizard</p>
</a>
</span>
</span>
Free (free of charge)
Free for personal and commercial use.
Author: Awesome Content