- Home >
- Stock Photos >
- Futuristic Data Visualization and Graph Analytics on Green Interface
Futuristic Data Visualization and Graph Analytics on Green Interface Image

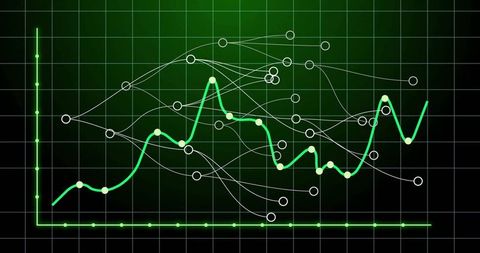
Visual representation of statistical data on green-themed grid can be used in tech presentations and data analysis reports, ideal for illustrating concepts in cybersecurity, analytics, business strategy, and technology trends. Incorporates futuristic elements appealing to professionals in data science, IT, and finance.

downloads
Tags:
More
Credit Photo
If you would like to credit the Photo, here are some ways you can do so
Text Link
photo Link
<span class="text-link">
<span>
<a target="_blank" href=https://pikwizard.com/photo/futuristic-data-visualization-and-graph-analytics-on-green-interface/ab28a57a620cd1b9362e64df7ecada87/>PikWizard</a>
</span>
</span>
<span class="image-link">
<span
style="margin: 0 0 20px 0; display: inline-block; vertical-align: middle; width: 100%;"
>
<a
target="_blank"
href="https://pikwizard.com/photo/futuristic-data-visualization-and-graph-analytics-on-green-interface/ab28a57a620cd1b9362e64df7ecada87/"
style="text-decoration: none; font-size: 10px; margin: 0;"
>
<img src="https://pikwizard.com/pw/medium/ab28a57a620cd1b9362e64df7ecada87.jpg" style="margin: 0; width: 100%;" alt="" />
<p style="font-size: 12px; margin: 0;">PikWizard</p>
</a>
</span>
</span>
Free (free of charge)
Free for personal and commercial use.
Author: People Creations