- Home >
- Stock Photos >
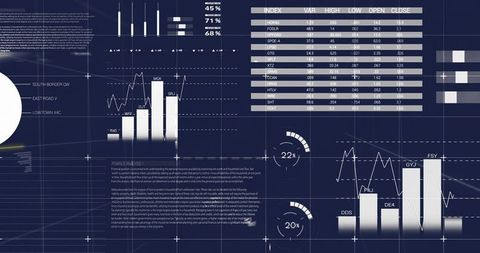
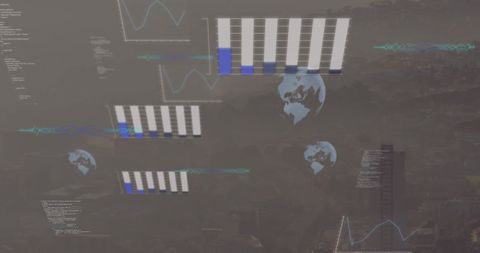
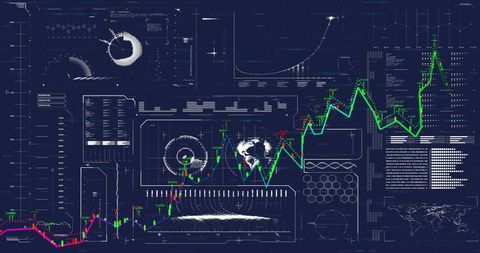
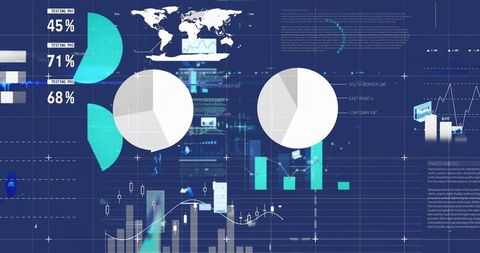
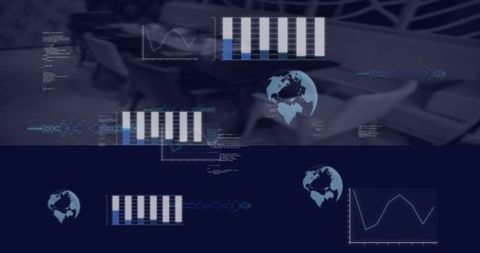
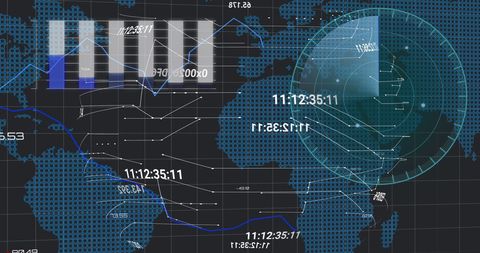
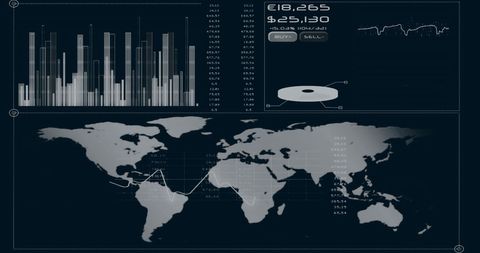
- Futuristic Data Visualization and Monitoring Interface
Futuristic Data Visualization and Monitoring Interface Image

Image illustrating advanced data visualization with floating code fragments, globe icons, and virtual bar charts on a digital interface. Perfect for technology blogs, articles on data analytics, and presentations about innovative visualization techniques. Suitable for illustrating concepts of global data analysis and cutting-edge technological monitoring systems.

downloads
Tags:
More
Credit Photo
If you would like to credit the Photo, here are some ways you can do so
Text Link
photo Link
<span class="text-link">
<span>
<a target="_blank" href=https://pikwizard.com/photo/futuristic-data-visualization-and-monitoring-interface/d01110ad7810e28e704cf2e17f4f5bcd/>PikWizard</a>
</span>
</span>
<span class="image-link">
<span
style="margin: 0 0 20px 0; display: inline-block; vertical-align: middle; width: 100%;"
>
<a
target="_blank"
href="https://pikwizard.com/photo/futuristic-data-visualization-and-monitoring-interface/d01110ad7810e28e704cf2e17f4f5bcd/"
style="text-decoration: none; font-size: 10px; margin: 0;"
>
<img src="https://pikwizard.com/pw/medium/d01110ad7810e28e704cf2e17f4f5bcd.jpg" style="margin: 0; width: 100%;" alt="" />
<p style="font-size: 12px; margin: 0;">PikWizard</p>
</a>
</span>
</span>
Free (free of charge)
Free for personal and commercial use.
Author: Awesome Content