
- Home >
- Stock Photos >
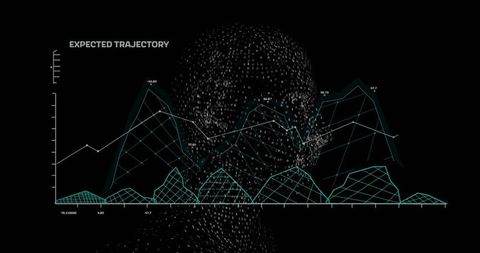
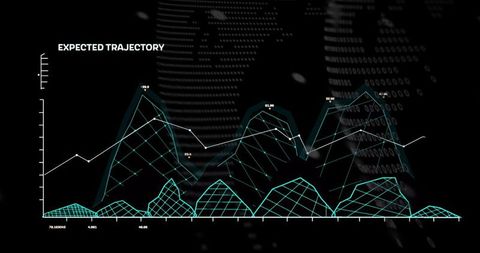
- Futuristic Data Visualization Chart with Digital Mountain Peaks
Futuristic Data Visualization Chart with Digital Mountain Peaks Image

Abstract representation of scientific or technological data with modern digital effect and technical style engages viewers. Can be used for business presentations, scientific research illustrations, technology showcases or educational materials demonstrating data analytics or forecasting techniques. Emphasizes progress, accuracy, potential and insights within digital information processing.
Powered by 


downloads
Tags:
More
Credit Photo
If you would like to credit the Photo, here are some ways you can do so
Text Link
photo Link
<span class="text-link">
<span>
<a target="_blank" href=https://pikwizard.com/photo/futuristic-data-visualization-chart-with-digital-mountain-peaks/7048602d444024663e9cbdaf9b1ecd78/>PikWizard</a>
</span>
</span>
<span class="image-link">
<span
style="margin: 0 0 20px 0; display: inline-block; vertical-align: middle; width: 100%;"
>
<a
target="_blank"
href="https://pikwizard.com/photo/futuristic-data-visualization-chart-with-digital-mountain-peaks/7048602d444024663e9cbdaf9b1ecd78/"
style="text-decoration: none; font-size: 10px; margin: 0;"
>
<img src="https://pikwizard.com/pw/medium/7048602d444024663e9cbdaf9b1ecd78.jpg" style="margin: 0; width: 100%;" alt="" />
<p style="font-size: 12px; margin: 0;">PikWizard</p>
</a>
</span>
</span>
Free (free of charge)
Free for personal and commercial use.
Author: People Creations
Similar Free Stock Images

Premium


Premium


Premium


Premium


Premium

Premium

Premium


Premium


Premium


Premium


Premium

Premium

Premium


Premium

Premium

Premium


Premium


Premium


Premium


Premium

Premium


Premium


Premium


Premium


Premium


Explore More Free Stock Images