
- Home >
- Stock Photos >
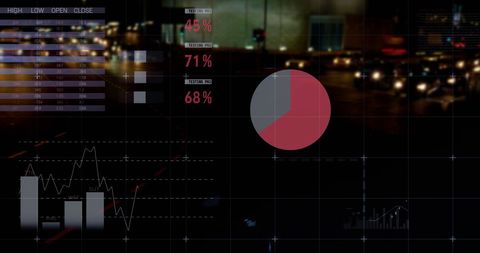
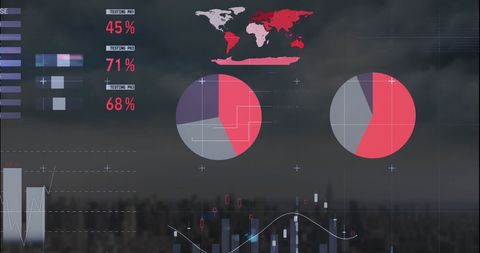
- Futuristic Data Visualization Dashboard with Glowing Globe
Futuristic Data Visualization Dashboard with Glowing Globe Image

This visual space used for futuristic themed presentations or sites focusing on data analytics. Useful in articles about technology, business, and digital innovations by exuding a high-tech yet accessible vibe.
Powered by 


downloads
Tags:
More
Credit Photo
If you would like to credit the Photo, here are some ways you can do so
Text Link
photo Link
<span class="text-link">
<span>
<a target="_blank" href=https://pikwizard.com/photo/futuristic-data-visualization-dashboard-with-glowing-globe/1c9d341fa59393ad243a8450e516b031/>PikWizard</a>
</span>
</span>
<span class="image-link">
<span
style="margin: 0 0 20px 0; display: inline-block; vertical-align: middle; width: 100%;"
>
<a
target="_blank"
href="https://pikwizard.com/photo/futuristic-data-visualization-dashboard-with-glowing-globe/1c9d341fa59393ad243a8450e516b031/"
style="text-decoration: none; font-size: 10px; margin: 0;"
>
<img src="https://pikwizard.com/pw/medium/1c9d341fa59393ad243a8450e516b031.jpg" style="margin: 0; width: 100%;" alt="" />
<p style="font-size: 12px; margin: 0;">PikWizard</p>
</a>
</span>
</span>
Free (free of charge)
Free for personal and commercial use.
Author: Creative Art
Similar Free Stock Images

Premium


Premium


Premium


Premium


Premium


Premium


Premium


Premium

Premium

Premium


Premium

Premium


Premium


Premium


Premium


Premium


Premium


Premium


Premium


Premium


Premium


Premium


Premium

Premium


Premium


Explore More Free Stock Images