
- Home >
- Stock Photos >
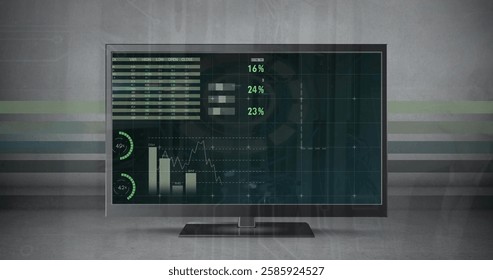
- Futuristic Data Visualization Dashboard with Neon Green Line Chart
Futuristic Data Visualization Dashboard with Neon Green Line Chart Image

The image shows a high-tech data visualization dashboard interface filled with various graphical information elements, prominently featuring a neon green line chart amongst other charts and text details. This digital, futuristic setup represents a cutting-edge technology approach to analytical data management, useful for presentations, business reports, scientific research, IT solutions, and media projects focused on advanced technology or data analysis concepts.
Powered by  - Get 15% off with code: PIKWIZARD15


downloads
Tags:
More
Credit Photo
If you would like to credit the Photo, here are some ways you can do so
Text Link
photo Link
<span class="text-link">
<span>
<a target="_blank" href=https://pikwizard.com/photo/futuristic-data-visualization-dashboard-with-neon-green-line-chart/716a5500b1ca01673a0949818eceb98e/>PikWizard</a>
</span>
</span>
<span class="image-link">
<span
style="margin: 0 0 20px 0; display: inline-block; vertical-align: middle; width: 100%;"
>
<a
target="_blank"
href="https://pikwizard.com/photo/futuristic-data-visualization-dashboard-with-neon-green-line-chart/716a5500b1ca01673a0949818eceb98e/"
style="text-decoration: none; font-size: 10px; margin: 0;"
>
<img src="https://pikwizard.com/pw/medium/716a5500b1ca01673a0949818eceb98e.jpg" style="margin: 0; width: 100%;" alt="" />
<p style="font-size: 12px; margin: 0;">PikWizard</p>
</a>
</span>
</span>
Free (free of charge)
Free for personal and commercial use.
Author: People Creations
Similar Free Stock Images

Premium


Premium


Premium


Premium

Premium


Premium


Premium


Premium

Premium


Premium


Premium

Premium


Premium


Premium

Premium

Premium


Premium


Premium


Premium


Premium


Premium

Premium


Premium


Premium

Premium


Explore More Free Stock Images