
- Home >
- Stock Photos >
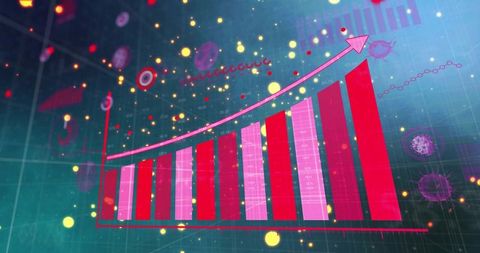
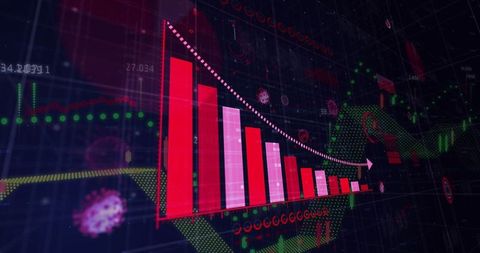
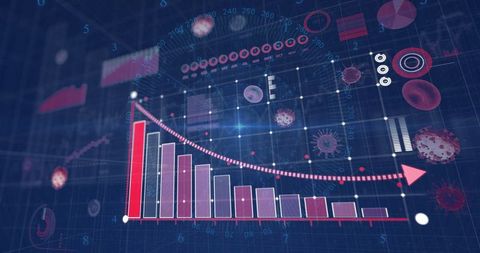
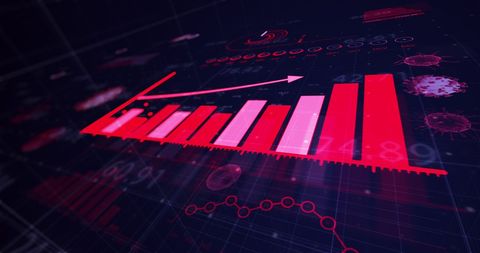
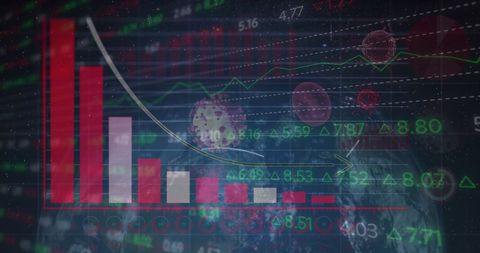
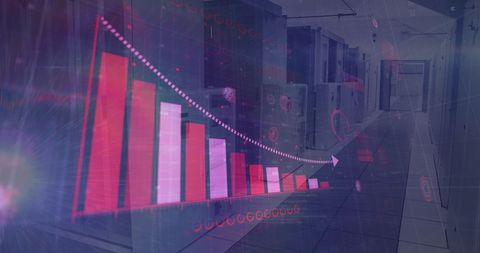
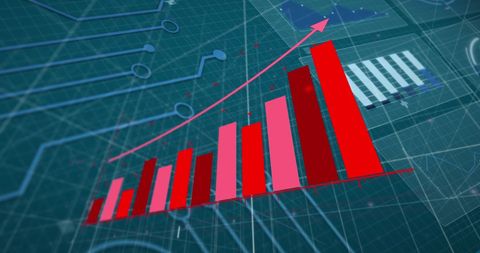
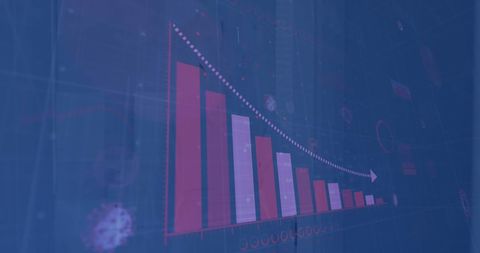
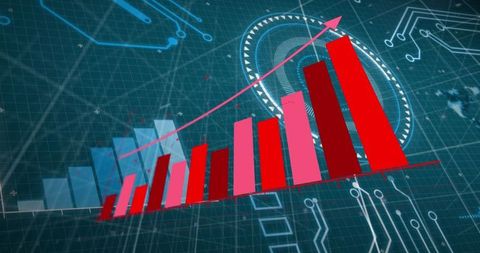
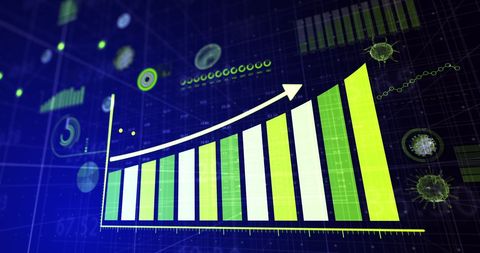
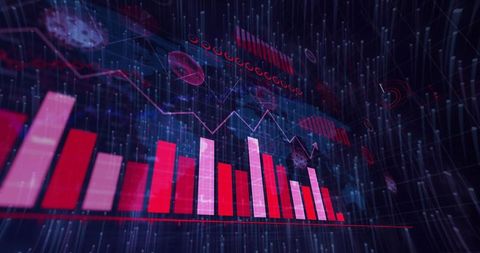
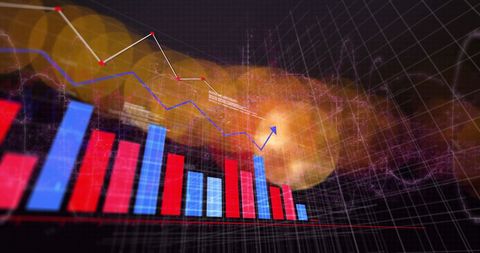
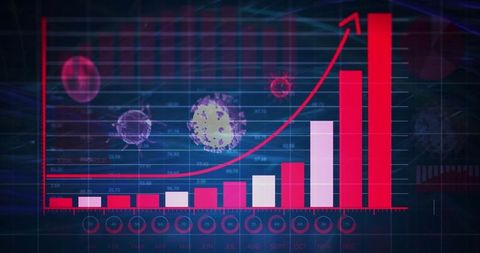
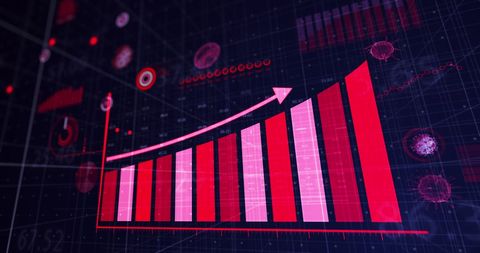
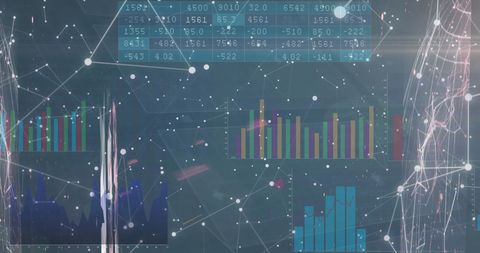
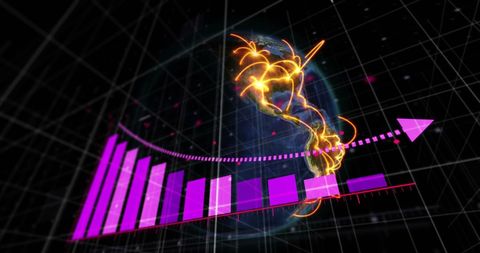
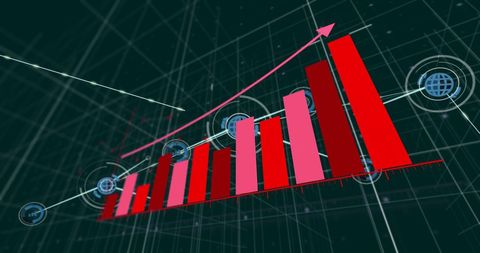
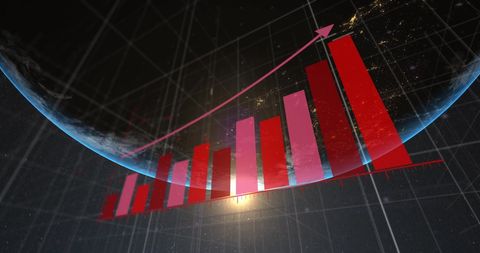
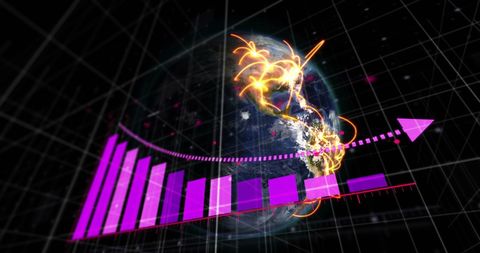
- Futuristic Data Visualization Digital Interface with Rising Bar Chart
Futuristic Data Visualization Digital Interface with Rising Bar Chart Image
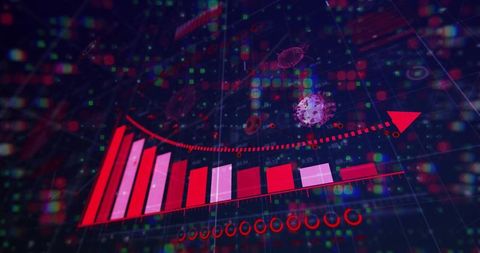
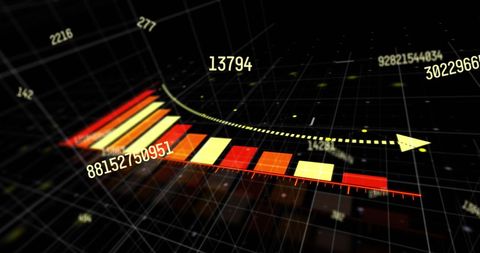
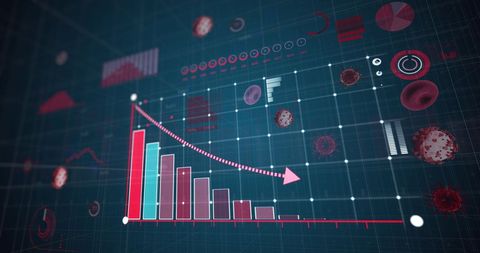
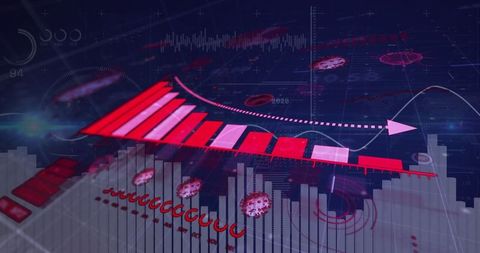
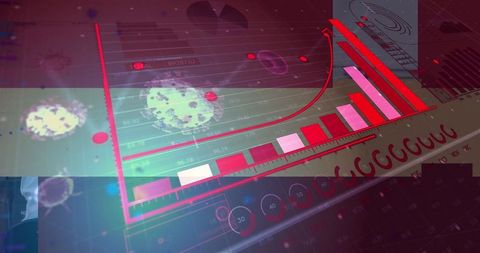
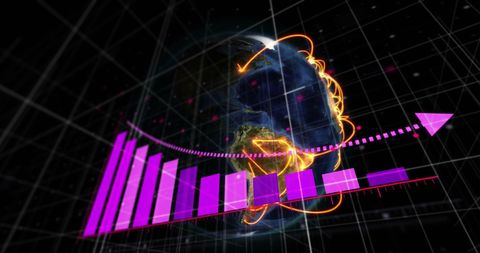
This graphic displays a futuristic interface combining data analytics and digital visualization for impactful presentations. The holographic rising bar chart signifies upward trends intersecting with technology themes. Use it for illustrating future forecasting, tech-driven insights, business analytics, or big data seminars presentations to convey innovation and advancement.
Powered by 


downloads
Tags:
More
Credit Photo
If you would like to credit the Photo, here are some ways you can do so
Text Link
photo Link
<span class="text-link">
<span>
<a target="_blank" href=https://pikwizard.com/photo/futuristic-data-visualization-digital-interface-with-rising-bar-chart/7e0e771a974793e0a18dd6bc357bddfe/>PikWizard</a>
</span>
</span>
<span class="image-link">
<span
style="margin: 0 0 20px 0; display: inline-block; vertical-align: middle; width: 100%;"
>
<a
target="_blank"
href="https://pikwizard.com/photo/futuristic-data-visualization-digital-interface-with-rising-bar-chart/7e0e771a974793e0a18dd6bc357bddfe/"
style="text-decoration: none; font-size: 10px; margin: 0;"
>
<img src="https://pikwizard.com/pw/medium/7e0e771a974793e0a18dd6bc357bddfe.jpg" style="margin: 0; width: 100%;" alt="" />
<p style="font-size: 12px; margin: 0;">PikWizard</p>
</a>
</span>
</span>
Free (free of charge)
Free for personal and commercial use.
Author: People Creations
Similar Free Stock Images
Premium

Premium


Premium

Premium


Premium


Premium


Premium


Premium


Premium

Premium


Premium


Premium


Premium


Premium


Premium

Premium


Premium


Premium


Premium


Premium


Premium


Premium


Premium


Premium


Premium

Explore More Free Stock Images