
- Home >
- Stock Photos >
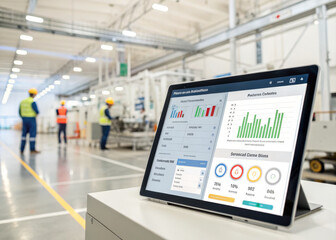
- Futuristic Data Visualization Displaying Glowing Pie Chart, Line Graphs, and Analytics Interface
Futuristic Data Visualization Displaying Glowing Pie Chart, Line Graphs, and Analytics Interface Image

Featuring glowing white pie chart centered over dark blue digital grid, blue lens flare streaking across center, and layered line and bar graphs indicating upward trends. Subtle numeric overlays, data points, and HUD-style icons enhancing futuristic analytics mood. Providing clean horizontal composition with central focal point and generous negative space for text or logo overlays. Ideal for business presentations, financial reports, investor decks, fintech websites, UI mockups, and data-driven marketing collateral. Helping communicate KPI tracking, market analysis, revenue growth, performance metrics, and predictive analytics in modern corporate or tech contexts.
Powered by 


downloads
Tags:
More
Credit Photo
If you would like to credit the Photo, here are some ways you can do so
Text Link
photo Link
<span class="text-link">
<span>
<a target="_blank" href=https://pikwizard.com/photo/futuristic-data-visualization-displaying-glowing-pie-chart-line-graphs-and-analytics-interface/e93536216e9724e0fad54be8b47f6332/>PikWizard</a>
</span>
</span>
<span class="image-link">
<span
style="margin: 0 0 20px 0; display: inline-block; vertical-align: middle; width: 100%;"
>
<a
target="_blank"
href="https://pikwizard.com/photo/futuristic-data-visualization-displaying-glowing-pie-chart-line-graphs-and-analytics-interface/e93536216e9724e0fad54be8b47f6332/"
style="text-decoration: none; font-size: 10px; margin: 0;"
>
<img src="https://pikwizard.com/pw/medium/e93536216e9724e0fad54be8b47f6332.jpg" style="margin: 0; width: 100%;" alt="" />
<p style="font-size: 12px; margin: 0;">PikWizard</p>
</a>
</span>
</span>
Free (free of charge)
Free for personal and commercial use.
Author: People Creations
Similar Free Stock Images

Premium


Premium


Premium


Premium


Premium


Premium


Premium


Premium

Premium

Premium


Premium

Premium


Premium


Premium


Premium


Premium


Premium


Premium


Premium


Premium


Premium


Premium

Premium


Premium

Premium

Explore More Free Stock Images