
- Home >
- Stock Photos >
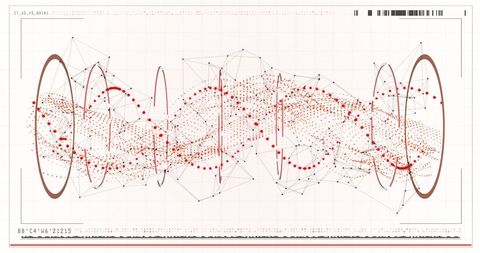
- Futuristic Data Visualization Graph Vector Rising Trend
Futuristic Data Visualization Graph Vector Rising Trend Image

This engaging depiction of a futuristic financial graph/chart displays a rising polyline to exemplify growth and trends in business data analysis. Perfect for content concerning financial forecasts, predicting stock market movements, and illustrate analytic data collection in presentations. Design elements include a sleek virtual dashboard setting, combining cross-grids with numeral-bars against smart holographic panels while plates mounted in varying destatures help declare sudden variations inside digital analysts maze.
Powered by 


downloads
Tags:
More
Credit Photo
If you would like to credit the Photo, here are some ways you can do so
Text Link
photo Link
<span class="text-link">
<span>
<a target="_blank" href=https://pikwizard.com/photo/futuristic-data-visualization-graph-vector-rising-trend/6cf61f6f94579f120f9afe780614620c/>PikWizard</a>
</span>
</span>
<span class="image-link">
<span
style="margin: 0 0 20px 0; display: inline-block; vertical-align: middle; width: 100%;"
>
<a
target="_blank"
href="https://pikwizard.com/photo/futuristic-data-visualization-graph-vector-rising-trend/6cf61f6f94579f120f9afe780614620c/"
style="text-decoration: none; font-size: 10px; margin: 0;"
>
<img src="https://pikwizard.com/pw/medium/6cf61f6f94579f120f9afe780614620c.jpg" style="margin: 0; width: 100%;" alt="" />
<p style="font-size: 12px; margin: 0;">PikWizard</p>
</a>
</span>
</span>
Free (free of charge)
Free for personal and commercial use.
Author: Creative Art
Similar Free Stock Images

Premium


Premium

Premium

Premium


Premium


Premium


Premium


Premium


Premium


Premium


Premium


Premium


Premium

Premium

Premium


Premium


Premium


Premium


Premium


Premium

Premium


Premium


Premium


Premium


Premium


Explore More Free Stock Images