- Home >
- Stock Photos >
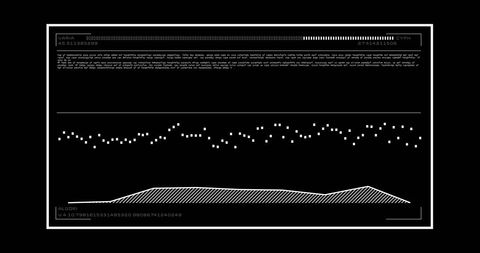
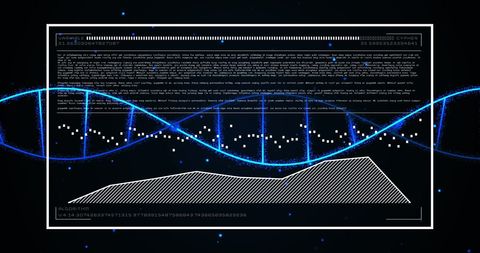
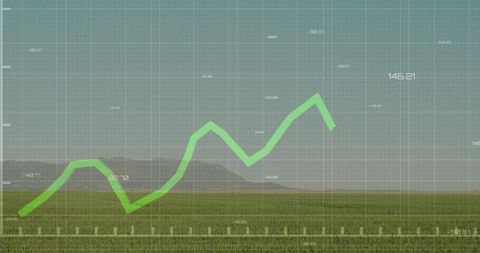
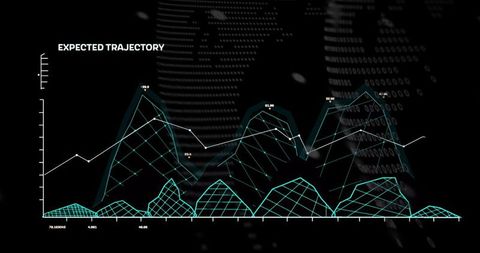
- Futuristic Data Visualization Interface with Algorithmic Details
Futuristic Data Visualization Interface with Algorithmic Details Image

This image showcases a high-tech digital interface displaying a confluence of algorithmic text, waveform graphics, and a point-cloud sphere. Ideal for illustrating concepts of big data analytics, technology advancements, and innovative digital solutions. Suitable for use in marketing materials for tech businesses, IT webinars, and educational content focused on modern data processing tools.

downloads
Tags:
More
Credit Photo
If you would like to credit the Photo, here are some ways you can do so
Text Link
photo Link
<span class="text-link">
<span>
<a target="_blank" href=https://pikwizard.com/photo/futuristic-data-visualization-interface-with-algorithmic-details/983c25aeed488d7aea9f7c6a1bd0e297/>PikWizard</a>
</span>
</span>
<span class="image-link">
<span
style="margin: 0 0 20px 0; display: inline-block; vertical-align: middle; width: 100%;"
>
<a
target="_blank"
href="https://pikwizard.com/photo/futuristic-data-visualization-interface-with-algorithmic-details/983c25aeed488d7aea9f7c6a1bd0e297/"
style="text-decoration: none; font-size: 10px; margin: 0;"
>
<img src="https://pikwizard.com/pw/medium/983c25aeed488d7aea9f7c6a1bd0e297.jpg" style="margin: 0; width: 100%;" alt="" />
<p style="font-size: 12px; margin: 0;">PikWizard</p>
</a>
</span>
</span>
Free (free of charge)
Free for personal and commercial use.
Author: Awesome Content