
- Home >
- Stock Photos >
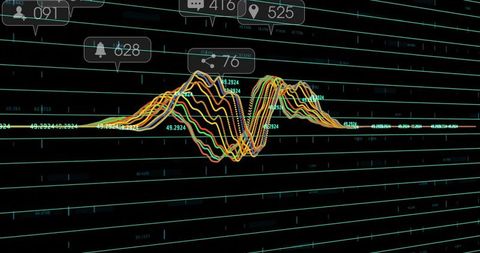
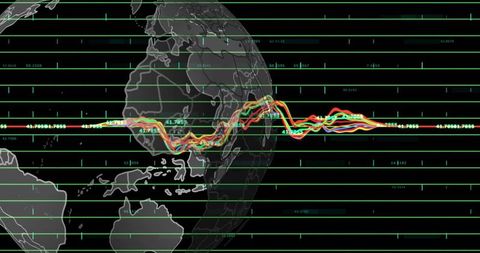
- Futuristic Data Visualization Interface with Globe and Analytics
Futuristic Data Visualization Interface with Globe and Analytics Image

This visualization depicts a futuristic, digital interface with waveform graphs fluctuating across a screen, set against a background of grid lines and an abstract globe. The inclusion of numeric labels speaks to high-end analytics and technology, making this ideal for materials discussing data science, technology trends, or financial analytics. Suitable for blog posts, articles, and presentations focusing on complex data insights or technological advancements.
Powered by  - Get 15% off with code: PIKWIZARD15


downloads
Tags:
More
Credit Photo
If you would like to credit the Photo, here are some ways you can do so
Text Link
photo Link
<span class="text-link">
<span>
<a target="_blank" href=https://pikwizard.com/photo/futuristic-data-visualization-interface-with-globe-and-analytics/1abecef87601286f482a36973de3f96d/>PikWizard</a>
</span>
</span>
<span class="image-link">
<span
style="margin: 0 0 20px 0; display: inline-block; vertical-align: middle; width: 100%;"
>
<a
target="_blank"
href="https://pikwizard.com/photo/futuristic-data-visualization-interface-with-globe-and-analytics/1abecef87601286f482a36973de3f96d/"
style="text-decoration: none; font-size: 10px; margin: 0;"
>
<img src="https://pikwizard.com/pw/medium/1abecef87601286f482a36973de3f96d.jpg" style="margin: 0; width: 100%;" alt="" />
<p style="font-size: 12px; margin: 0;">PikWizard</p>
</a>
</span>
</span>
Free (free of charge)
Free for personal and commercial use.
Author: Creative Art
Similar Free Stock Images

Premium


Premium

Premium


Premium


Premium


Premium


Premium


Premium


Premium


Premium


Premium


Premium


Premium


Premium


Premium


Premium


Premium


Premium


Premium


Premium

Premium


Premium


Premium


Premium


Premium


Explore More Free Stock Images