- Home >
- Stock Photos >
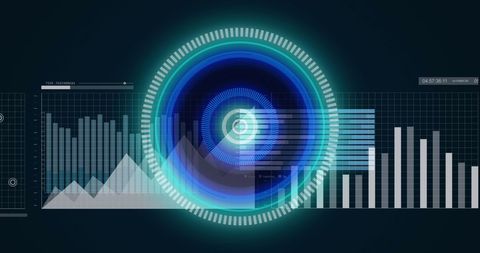
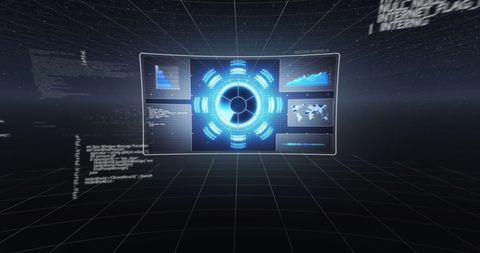
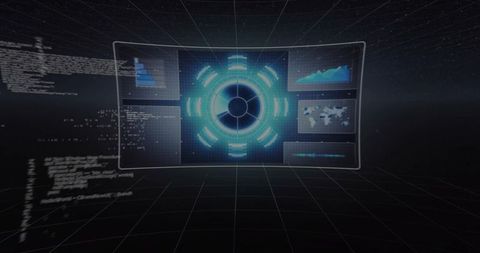
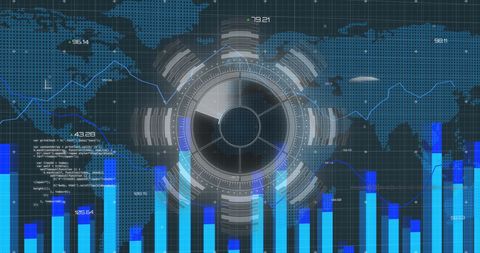
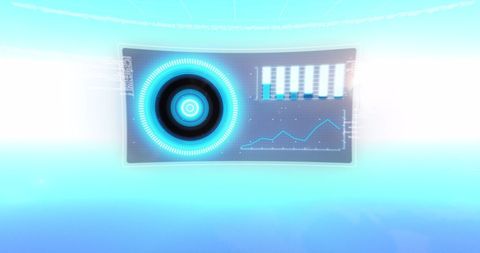
- Futuristic Data Visualization Interface with Hub and Bar Graphs
Futuristic Data Visualization Interface with Hub and Bar Graphs Image

Futuristic data visualization displaying circular hub and energy blue bar graphs on advanced digital interface. Vibrant graphics highlight trends in analytics and statistical analysis through appealing design. This visual can be used for technology reports, design materials on future analytics, infographics, or comprehensive technology presentations offering modern insights.

downloads
Tags:
More
Credit Photo
If you would like to credit the Photo, here are some ways you can do so
Text Link
photo Link
<span class="text-link">
<span>
<a target="_blank" href=https://pikwizard.com/photo/futuristic-data-visualization-interface-with-hub-and-bar-graphs/b374889e30026ab943d1918d63935738/>PikWizard</a>
</span>
</span>
<span class="image-link">
<span
style="margin: 0 0 20px 0; display: inline-block; vertical-align: middle; width: 100%;"
>
<a
target="_blank"
href="https://pikwizard.com/photo/futuristic-data-visualization-interface-with-hub-and-bar-graphs/b374889e30026ab943d1918d63935738/"
style="text-decoration: none; font-size: 10px; margin: 0;"
>
<img src="https://pikwizard.com/pw/medium/b374889e30026ab943d1918d63935738.jpg" style="margin: 0; width: 100%;" alt="" />
<p style="font-size: 12px; margin: 0;">PikWizard</p>
</a>
</span>
</span>
Free (free of charge)
Free for personal and commercial use.
Author: Awesome Content