- Home >
- Stock Photos >
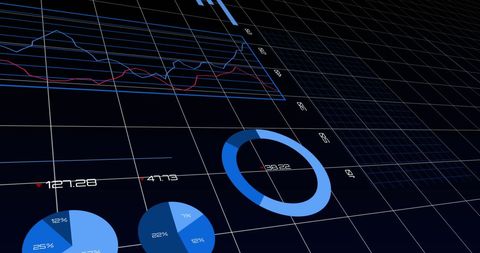
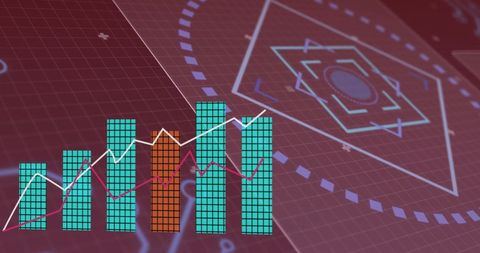
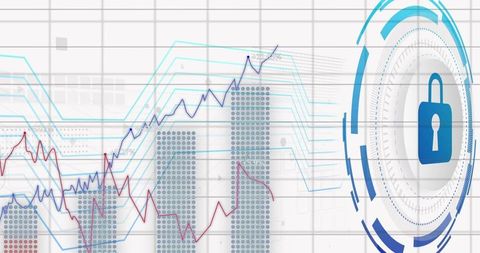
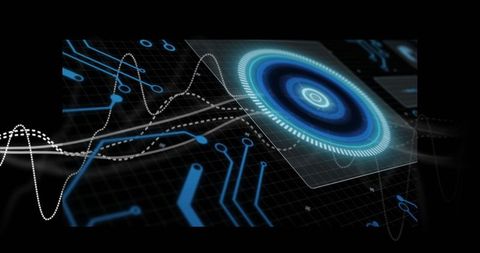
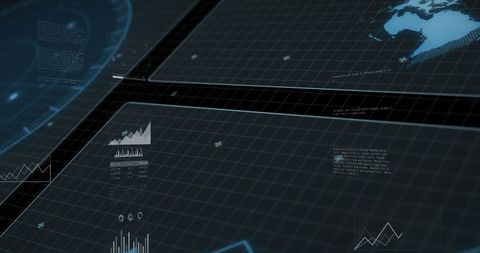
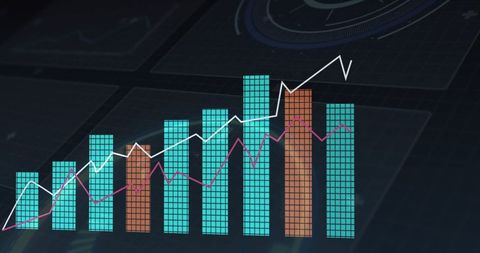
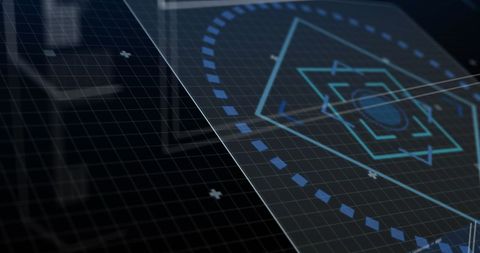
- Futuristic Data Visualization Interface with Neon Graphs
Futuristic Data Visualization Interface with Neon Graphs Image

This image features a futuristic representation of data graphs displayed on a digital interface. Neon green and yellow lines traverse over a grid, with geometrical patterns like a hexagon and dashed circles highlighting technological themes. Ideal for usage in contexts related to big data analysis, cyber technology presentations, digital marketing, and innovation discussions.

downloads
Tags:
More
Credit Photo
If you would like to credit the Photo, here are some ways you can do so
Text Link
photo Link
<span class="text-link">
<span>
<a target="_blank" href=https://pikwizard.com/photo/futuristic-data-visualization-interface-with-neon-graphs/d03c97a9fbe81f90260b83bd818d752e/>PikWizard</a>
</span>
</span>
<span class="image-link">
<span
style="margin: 0 0 20px 0; display: inline-block; vertical-align: middle; width: 100%;"
>
<a
target="_blank"
href="https://pikwizard.com/photo/futuristic-data-visualization-interface-with-neon-graphs/d03c97a9fbe81f90260b83bd818d752e/"
style="text-decoration: none; font-size: 10px; margin: 0;"
>
<img src="https://pikwizard.com/pw/medium/d03c97a9fbe81f90260b83bd818d752e.jpg" style="margin: 0; width: 100%;" alt="" />
<p style="font-size: 12px; margin: 0;">PikWizard</p>
</a>
</span>
</span>
Free (free of charge)
Free for personal and commercial use.
Author: People Creations