- Home >
- Stock Photos >
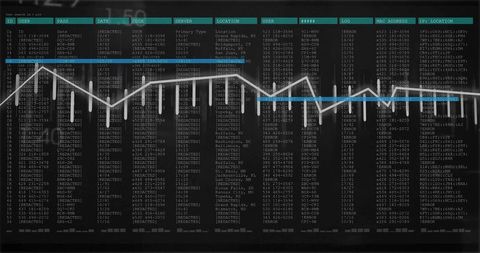
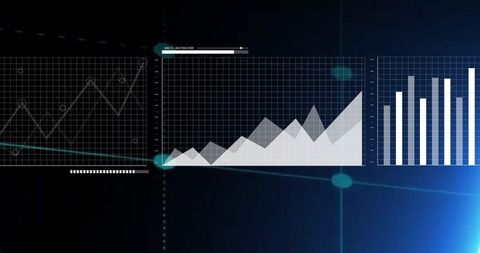
- Futuristic Data Visualization on Analytics Interface
Futuristic Data Visualization on Analytics Interface Image
This image shows a sophisticated analytics interface combining data visualizations, including graphs and charts, with snippets of code and error logs in the background. The design emphasizes a high-tech approach to data monitoring and analysis, making it suitable for representing themes related to cybersecurity, data management, technology advancement, and digital transformation. Ideal for use in technology presentations, software-related projects, and informational articles on big data or performance analytics.

downloads
Tags:
More
Credit Photo
If you would like to credit the Photo, here are some ways you can do so
Text Link
photo Link
<span class="text-link">
<span>
<a target="_blank" href=https://pikwizard.com/photo/futuristic-data-visualization-on-analytics-interface/41b6b99e24e6016178fb77d66f9adb06/>PikWizard</a>
</span>
</span>
<span class="image-link">
<span
style="margin: 0 0 20px 0; display: inline-block; vertical-align: middle; width: 100%;"
>
<a
target="_blank"
href="https://pikwizard.com/photo/futuristic-data-visualization-on-analytics-interface/41b6b99e24e6016178fb77d66f9adb06/"
style="text-decoration: none; font-size: 10px; margin: 0;"
>
<img src="https://pikwizard.com/pw/medium/41b6b99e24e6016178fb77d66f9adb06.jpg" style="margin: 0; width: 100%;" alt="" />
<p style="font-size: 12px; margin: 0;">PikWizard</p>
</a>
</span>
</span>
Free (free of charge)
Free for personal and commercial use.
Author: Creative Art