
- Home >
- Stock Photos >
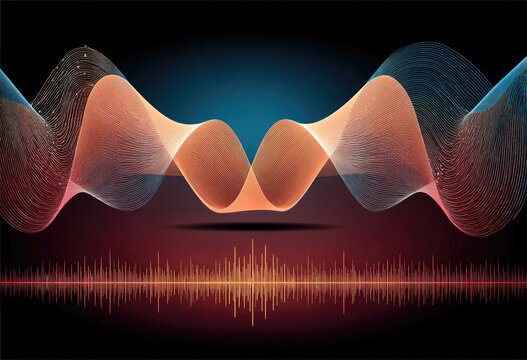
- Futuristic Data Visualization Oscillation Concept
Futuristic Data Visualization Oscillation Concept Image

Complex lines and patterns formed to represent global connectivity and data processing. This illustration is ideal for use in presentations related to technology, business analytics, and digital networks, providing a modern touch and appealing visual focal point for discussions about global data trends.
Powered by 


downloads
Tags:
More
Credit Photo
If you would like to credit the Photo, here are some ways you can do so
Text Link
photo Link
<span class="text-link">
<span>
<a target="_blank" href=https://pikwizard.com/photo/futuristic-data-visualization-oscillation-concept/9c08aac71757bfff1adb7d9cdee90ab5/>PikWizard</a>
</span>
</span>
<span class="image-link">
<span
style="margin: 0 0 20px 0; display: inline-block; vertical-align: middle; width: 100%;"
>
<a
target="_blank"
href="https://pikwizard.com/photo/futuristic-data-visualization-oscillation-concept/9c08aac71757bfff1adb7d9cdee90ab5/"
style="text-decoration: none; font-size: 10px; margin: 0;"
>
<img src="https://pikwizard.com/pw/medium/9c08aac71757bfff1adb7d9cdee90ab5.jpg" style="margin: 0; width: 100%;" alt="" />
<p style="font-size: 12px; margin: 0;">PikWizard</p>
</a>
</span>
</span>
Free (free of charge)
Free for personal and commercial use.
Author: Authentic Images
Similar Free Stock Images

Premium


Premium

Premium


Premium

Premium


Premium


Premium


Premium


Premium

Premium


Premium


Premium


Premium


Premium


Premium


Premium

Premium

Premium


Premium


Premium


Premium


Premium

Premium


Premium


Premium


Explore More Free Stock Images