
- Home >
- Stock Photos >
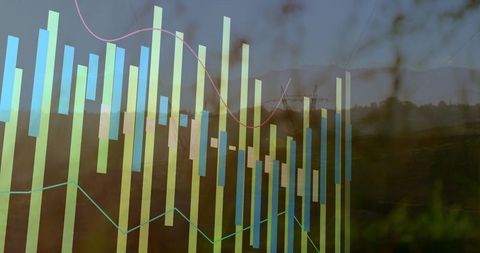
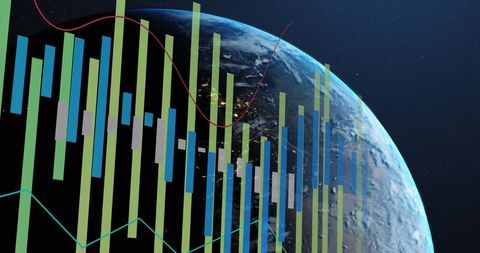
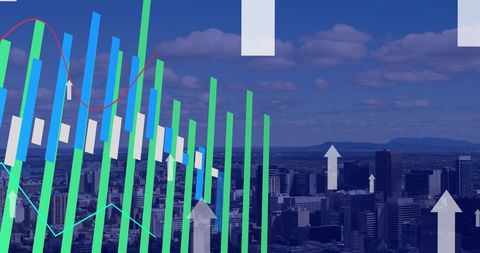
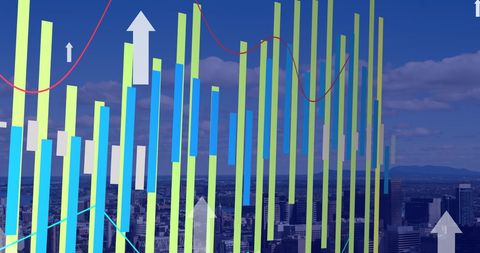
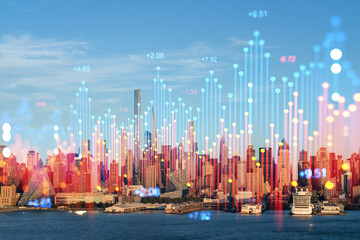
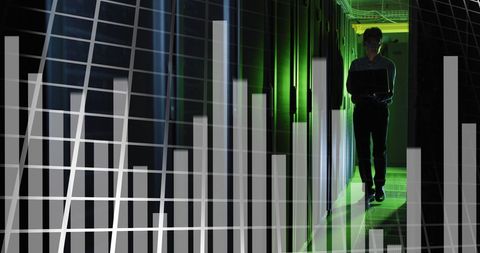
- Futuristic Data Visualization Over Cityscape Background
Futuristic Data Visualization Over Cityscape Background Image

Image shows abstract digital graphics of data processing over a cityscape representing modern financial analytics and technological advancement. Useful for illustrating global business concepts, financial growth reports, and technology development topics. Ideal for presentations focusing on big data, digital transformations, or business network associations.
Powered by 


downloads
Tags:
More
Credit Photo
If you would like to credit the Photo, here are some ways you can do so
Text Link
photo Link
<span class="text-link">
<span>
<a target="_blank" href=https://pikwizard.com/photo/futuristic-data-visualization-over-cityscape-background/b0d45928fb9877b304ab79d11395eb57/>PikWizard</a>
</span>
</span>
<span class="image-link">
<span
style="margin: 0 0 20px 0; display: inline-block; vertical-align: middle; width: 100%;"
>
<a
target="_blank"
href="https://pikwizard.com/photo/futuristic-data-visualization-over-cityscape-background/b0d45928fb9877b304ab79d11395eb57/"
style="text-decoration: none; font-size: 10px; margin: 0;"
>
<img src="https://pikwizard.com/pw/medium/b0d45928fb9877b304ab79d11395eb57.jpg" style="margin: 0; width: 100%;" alt="" />
<p style="font-size: 12px; margin: 0;">PikWizard</p>
</a>
</span>
</span>
Free (free of charge)
Free for personal and commercial use.
Author: People Creations
Similar Free Stock Images
Premium


Premium


Premium


Premium


Premium


Premium


Premium


Premium

Premium


Premium


Premium


Premium


Premium


Premium


Premium


AI


Premium


Premium

Premium


Premium

Premium

Premium


Premium


Premium

Premium


Premium


Explore More Free Stock Images