- Home >
- Stock Photos >
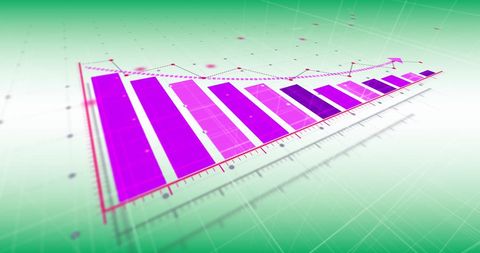
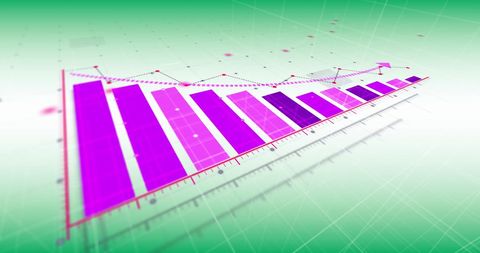
- Futuristic Data Visualization with Bar Chart Over Digital Grid
Futuristic Data Visualization with Bar Chart Over Digital Grid Image

Illustrates the modern approach to analytics using a bar chart and digital grid background, perfect for presentations on technology trends, data science, or financial reports. Useful for educational resources or software company portfolios.

downloads
Tags:
More
Credit Photo
If you would like to credit the Photo, here are some ways you can do so
Text Link
photo Link
<span class="text-link">
<span>
<a target="_blank" href=https://pikwizard.com/photo/futuristic-data-visualization-with-bar-chart-over-digital-grid/fcbbf33ef38dceb6948d9f196d91bea1/>PikWizard</a>
</span>
</span>
<span class="image-link">
<span
style="margin: 0 0 20px 0; display: inline-block; vertical-align: middle; width: 100%;"
>
<a
target="_blank"
href="https://pikwizard.com/photo/futuristic-data-visualization-with-bar-chart-over-digital-grid/fcbbf33ef38dceb6948d9f196d91bea1/"
style="text-decoration: none; font-size: 10px; margin: 0;"
>
<img src="https://pikwizard.com/pw/medium/fcbbf33ef38dceb6948d9f196d91bea1.jpg" style="margin: 0; width: 100%;" alt="" />
<p style="font-size: 12px; margin: 0;">PikWizard</p>
</a>
</span>
</span>
Free (free of charge)
Free for personal and commercial use.
Author: Creative Art