
- Home >
- Stock Photos >
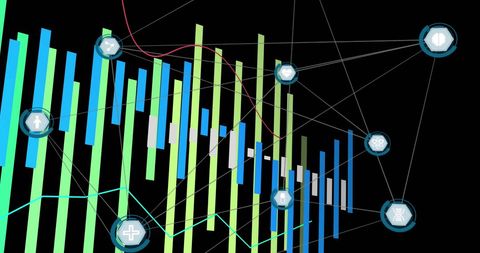
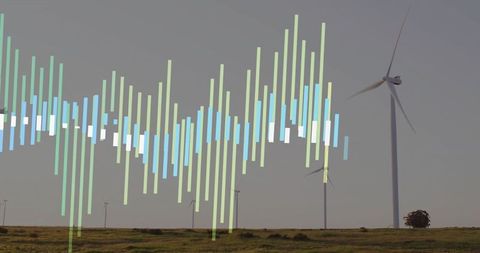
- Futuristic Data Visualization with Bars and Pie Charts
Futuristic Data Visualization with Bars and Pie Charts Image

Dynamic depiction of a digital data interface showing vertical bars and pie charts. Designed for illustrating data-driven technology, this composition can be used in presentations about market trends, tech innovations, or analytical software. Perfect for companies focusing on big data, insight processing, or digital innovations.
Powered by 


downloads
Tags:
More
Credit Photo
If you would like to credit the Photo, here are some ways you can do so
Text Link
photo Link
<span class="text-link">
<span>
<a target="_blank" href=https://pikwizard.com/photo/futuristic-data-visualization-with-bars-and-pie-charts/9285d449118fa08fb7bc36036db0980a/>PikWizard</a>
</span>
</span>
<span class="image-link">
<span
style="margin: 0 0 20px 0; display: inline-block; vertical-align: middle; width: 100%;"
>
<a
target="_blank"
href="https://pikwizard.com/photo/futuristic-data-visualization-with-bars-and-pie-charts/9285d449118fa08fb7bc36036db0980a/"
style="text-decoration: none; font-size: 10px; margin: 0;"
>
<img src="https://pikwizard.com/pw/medium/9285d449118fa08fb7bc36036db0980a.jpg" style="margin: 0; width: 100%;" alt="" />
<p style="font-size: 12px; margin: 0;">PikWizard</p>
</a>
</span>
</span>
Free (free of charge)
Free for personal and commercial use.
Author: People Creations
Similar Free Stock Images

Premium

Premium


Premium


Premium

Premium


Premium


Premium


Premium

Premium

Premium


Premium


Premium

Premium


Premium

Premium

Premium

Premium


Premium


Premium


Premium

Premium


Premium


Premium

Premium


Premium


Explore More Free Stock Images