1. Home > 
  2. Stock Photos > 
  3. Futuristic Data Visualization with Code and Graphs

Futuristic Data Visualization with Code and Graphs Image

Futuristic Data Visualization with Code and Graphs

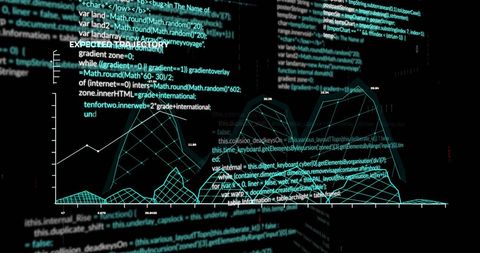
A detailed digital portrayal showing interactive graphs and coding lines against a dark background, perfect for use in presentations involving modern technology, programming workshops, augmented reality concepts, or articles about data science in global economic contexts.

Powered by Adobe logo
Abstract, Big data network and AI technology, Deep learning and algorithm, Innovative and Data science, Businessman touch a data flow on global network and Fast connection. The world is in your hands. - Powered by AdobeInnovative technology for data visualization with a businessman touching a holographic financial graph - Powered by AdobeEngineer analyzing data on a notebook with AI visualization in server room - Powered by AdobeEnvironmental scientist analyzing global climate data on digital tablet, futuristic world map interface, modern technology, focused expression, innovation in environmental research - Powered by AdobeBig data technology data science analysis artificial intelligence generative ai deep learning machine learning algorithm neural flow network analytics innovation abstract futuristic. 3d rendering. - Powered by Adobe

Credit Photo

If you would like to credit the Photo, here are some ways you can do so

Free (free of charge)

Free for personal and commercial use.

Author: Creative Art

Similar Free Stock Images

Loading...
Dynamic Stock Market Concept with Colorful Line Graphs
Premium
Big data technology visualization faceless data science analysis defocused artificial intelligence background generative AI deep learning machine learning algorithm display
Digital DNA Strand Visualization on Modern Interface Background
Premium
Digital data analyzing financial trading technology concept
Premium
Data analyzing and stock market visualization with digital charts, financial dashboards, and performance metrics. Ideal for investment analysis, trading strategy, and economic forecasting.
Digital Head and Data Processing on Futuristic Interface
Abstract Digital Interface with Data Processing Code
Dynamic Green Stock Chart on Digital Grid Background
Futuristic Digital Interface with Spiraling Coding Patterns
Digital Ruble Symbol with Data Graph Overlay
Digital Interface Merging Chemical Formulas and Data Processing Concepts
Cybersecurity Interface with Digital Shield Icon Displayed
Digital Financial Data Analysis with Graphs and Stock Market Trends
Premium
Abstract data visualization
Premium
Back view of a woman analyzing a holographic stock market graph, glowing data visualizations, and futuristic interface representing finance, technology, and analytics.
Dynamic Financial Data Processing on Digital Screen
Dynamic Statistical Data Analysis on Digital Grid Network
Dynamic Digital Statistics Display in Blue Tones
Holographic Financial Stock Market Analysis Visualization
Futuristic Cityscape Intertwined with Digital Code Matrix
Premium
Close-up of woman with headset and network of glowing connections on face, concept for telecommunications interface, data visualization and advanced technology integration
AI Text Overlaid on Digital Code Background
Digital Financial Data Analysis on Grid Framework
Digital Financial Data Visualization on Dark Screen
Digital Interface and Coding with Data Flow Diagrams
Premium
Dynamic 3D bar chart visualization with glowing lights faceless data growth representation defocused red and blue background financial analysis display modern tech environment
Digital Graph Display with Dynamic Data Visualization on Black Background
Futuristic Cybercode Illumination in Wireframe Cyberspace
Stylized Audio Wave in Virtual Data Tunnel
Cyber Analytics Dashboard Showing Multicolor Waveforms on Neon Cyan Grid Interface
Premium
Programmer typing on laptop with colorful data flow visualization, concept of artificial intelligence, big data analysis, machine learning, and digital technology innovation
Colorful Stock Market Graph Displaying Economic Trends
Financial Data and Graphs on Digital Screen
Dynamic Digital Stock Market Ticker with Growing Graph Trends
Financial Data Overlays Cityscape Signifying Market Dynamics
Cybersecurity Concept with Digital Lock and Computer Code
Futuristic Data Visualization on Black Background
Premium
Business professionals observing a large digital screen with abstract data visualization during a conference, concept for business intelligence, technology innovation and corporate training
Dynamic Financial Data Streams for Market Analysis
Futuristic Programming Interface with Digital Connectivity
Digital Financial Display with Graphs and Data Analysis
Dynamic Data Visualization with Businesspeople Walk
Businesswomen Collaborating with Data Analytics Overlay in Modern Office
Premium
A focused individual types on a keyboard while digital graphs show business growth metrics and trends, highlighting the impact of data analysis on strategic decisions. Copula
Dynamic Business Analysis with Global Digital Interface Figures
Financial Data Analysis with Code Interface on Black Background
Abstract Financial Market Data with CGI and Code Overlay
Cybernetic Data Flow with Digital Network Connections
Premium
A sports analyst focuses intently on several monitors, analyzing data and statistics from a live football match. The setting is a high-tech office with a vibrant atmosphere.
Global Financial Technology Network and Data Analytics
Digital Cityscape with Financial Data Overlay
Soundwave Visualization and Data Analysis on Digital Grid
Advanced Data Processing with Graphs and Futuristic Network Overlay
Premium
Scientists analyzing DNA data in high-tech lab.
Premium
Professional businessman analyzing global data on interactive screens, visualizing network connections and international business strategies
Abstract Data Visualization with Dynamic Coding and Analytics
Abstract Digital Data and Network Connections Background
Digital DNA and Brain Data Interface Display in Dark Theme
Financial Analytics Dashboard with Dynamic Charts and Script Display
Premium
A creative representation of growth, featuring glowing bars that symbolize increasing values against a blurred urban background.
Digital Code Interface with Graphs on Blue Background
Glowing Code Editor Under Neon Green Grid Overlay with Syntax Highlighting and Waveform
Digital Data Streams in Futuristic Virtual Interface
Stock Market Trends Visual with Growth Charts on Black Background
Premium
Business professionals analyzing data on large screen collaborative teamwork
Digital Financial Data with Trending Arrows
Digital Code Reflection in Grid Overlay Business Interface
Digital Head and Data Visualization in Futuristic Grid
Data Processing and Graph Over Complex Code Background
Premium
Young woman analyzing colorful illuminated digital data visualization with futuristic technology and artificial intelligence concept in dark room
Premium
Business team analyzing financial documents, charts and graphs using digital tablets during a meeting to discuss company's performance and sales using data visualization tools
Premium
Abstract futuristic technology background with glowing lines charts and data visualization
Digital Financial Data Interface on Green Background
Abstract Digital Interface for Medical Data Processing
Digital Line Graph Overlay on Modern Office Space
Digital Interface with Graphs and Data Lines in Cyber Space
Analyzing Stock Market Data Trends with Futuristic Visuals
Digital Finance Data Overload with Code and Graphs
Cryptocurrency Trends and Data Visualization Concept
Dynamic Data Processing Concept in Digital Interface Design
Premium
Abstract digital data visualization with glowing blue and orange vertical bars on a dark background
Abstract Digital Network with Colorful Data Lines and Shapes
Digital Financial Data Analytics on Dark Interface
Data Visualization on Digital Interface with Graphs and Codes
Financial Data Analytics with Dynamic Green Arrows
Futuristic Data Terminal with Code and Digital Interface Overlay
Dynamic Data Code with Digital Visualization Overlay
World Map with Digital Data Stream and Processing Interface
Futuristic Digital Data Network with Analytics Overlay
Premium
3D data visualization graph, lines, dots on a digital tablet, with vibrant blue color highlighting statistical data against the blurred background.
Overlaid Line Graph on Network Dashboard; Data Monitoring and Analytics
Floating Code Blocks in Futuristic Data Space
Neon code cluster floating over translucent green grid interface glowing data visualization
Dynamic Financial Data Display in Digital Space
Dynamic Stock Market Trends with Graphs on Digital Display
Digital Financial Data Interface with Analytics
Financial Data Streaming with Arrows Over Graphic Indicators
Digital Interface with Data Streams and Code Overlay
Futuristic Data Visualization Chart with Digital Mountain Peaks
Data Processing and Analysis Visualization on Black Background
Digital Interface with Data Graphs and Charts
Global Network Data Visualization with Programming Code
Digital Data Visualization with World Map and Graphs
Abstract Data and Technology with Business Facilitator
Premium
Abstract world map with glowing connections and data visualization
Data Security with Tech Bar Graph Overlay
Financial Data Processing with Digital Patterns for Global Business
Financial Data and Stock Market Analysis on Digital Screen
Digitized Financial Data Analysis with Graphs and Codes
Premium
Modern business team analyzing data on a large digital screen with holographic charts and virtual interface. Concept of artificial intelligence, analytics, innovation, teamwork, cybersecurity,
Sound Wave Visualization with Programming Code Elements
Global Digital Interface with Data Points and Connectivity
Abstract Digital Stock Market Analysis with Graphs
Premium
Financial market data analysis with glowing 3D bar and line charts on dark background showing economic trends and growth concept visualization. 3D Rendering
Digital Financial Data Indicators Visualization
Futuristic Dashboard Interface with Digital Hologram and Coding Elements
Digital Data Processing Over Black Background with Green Code
Digital Financial Data Display Screen with Analytics
Premium
A person analyzing stock market data on a digital screen, showcasing charts and graphs. Ideal for illustrating finance, investment, and modern technology in business.
Digital Interface Visualizing DNA and Data Patterns
Futuristic Neon NFT Text with Data Codes Background
Futuristic Digital Waveform Analytics on Neon Green Interface
Highlighted Code Overlapping Line Graphs in Virtual Environment
Premium
A person analyzing a growth chart with upward trends, signifying progress and success in data or business metrics.
Displaying white line chart overlay on dark code dashboard with analytics grid and binder