
- Home >
- Stock Photos >
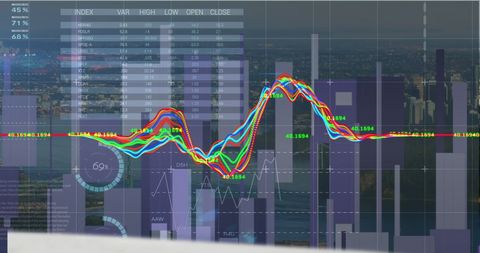
- Futuristic Data Visualization with Colorful Waveforms on Digital Interface
Futuristic Data Visualization with Colorful Waveforms on Digital Interface Image

This image illustrates a complex data visualization on a high-tech digital interface. It features colorful waveforms overlaid on a numeric table with faint bar chart columns, depicting various statistics or analytics. Ideal for use in technology-related presentations, business analytics displays, educational materials, or as a visual representation of digital data dynamics in reports. The futuristic and innovative look makes it suitable for conveying cutting-edge technologies and analytics tools.
Powered by 


downloads
Tags:
More
Credit Photo
If you would like to credit the Photo, here are some ways you can do so
Text Link
photo Link
<span class="text-link">
<span>
<a target="_blank" href=https://pikwizard.com/photo/futuristic-data-visualization-with-colorful-waveforms-on-digital-interface/377381859402de131e56a79b18061f38/>PikWizard</a>
</span>
</span>
<span class="image-link">
<span
style="margin: 0 0 20px 0; display: inline-block; vertical-align: middle; width: 100%;"
>
<a
target="_blank"
href="https://pikwizard.com/photo/futuristic-data-visualization-with-colorful-waveforms-on-digital-interface/377381859402de131e56a79b18061f38/"
style="text-decoration: none; font-size: 10px; margin: 0;"
>
<img src="https://pikwizard.com/pw/medium/377381859402de131e56a79b18061f38.jpg" style="margin: 0; width: 100%;" alt="" />
<p style="font-size: 12px; margin: 0;">PikWizard</p>
</a>
</span>
</span>
Free (free of charge)
Free for personal and commercial use.
Author: Creative Art
Similar Free Stock Images

Premium


Premium


Premium

Premium

Premium


Premium


Premium


Premium

Premium

Premium


Premium


Premium


Premium


Premium

Premium

Premium


Premium


Premium


Premium


Premium


Premium


Premium


Premium


Premium


Premium

Explore More Free Stock Images