
- Home >
- Stock Photos >
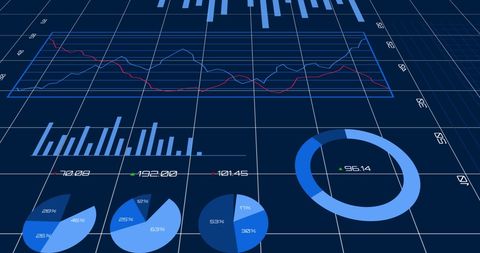
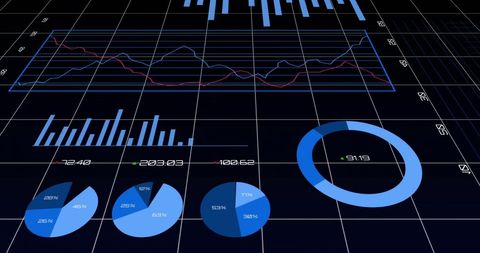
- Futuristic Data Visualization with Cyan Bars and Red Line
Futuristic Data Visualization with Cyan Bars and Red Line Image

Dynamic display of data with bars and line on a 3D grid, perfect for financial presentations and tech-oriented dashboards showcasing analytical insights, market trends, investment opportunities, and innovative products.
Powered by 


downloads
Tags:
More
Credit Photo
If you would like to credit the Photo, here are some ways you can do so
Text Link
photo Link
<span class="text-link">
<span>
<a target="_blank" href=https://pikwizard.com/photo/futuristic-data-visualization-with-cyan-bars-and-red-line/f5c8c275b52db7b86628ddcd27f1e8a8/>PikWizard</a>
</span>
</span>
<span class="image-link">
<span
style="margin: 0 0 20px 0; display: inline-block; vertical-align: middle; width: 100%;"
>
<a
target="_blank"
href="https://pikwizard.com/photo/futuristic-data-visualization-with-cyan-bars-and-red-line/f5c8c275b52db7b86628ddcd27f1e8a8/"
style="text-decoration: none; font-size: 10px; margin: 0;"
>
<img src="https://pikwizard.com/pw/medium/f5c8c275b52db7b86628ddcd27f1e8a8.jpg" style="margin: 0; width: 100%;" alt="" />
<p style="font-size: 12px; margin: 0;">PikWizard</p>
</a>
</span>
</span>
Free (free of charge)
Free for personal and commercial use.
Author: Awesome Content
Similar Free Stock Images

Premium


Premium


Premium


Premium


Premium


Premium


Premium

Premium


Premium


Premium


Premium


Premium


Premium


Premium


Premium

Premium


Premium

Premium


Premium


Premium


Premium


Premium

Premium


Premium


Premium

Explore More Free Stock Images