
- Home >
- Stock Photos >
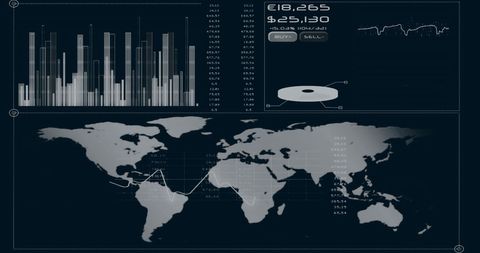
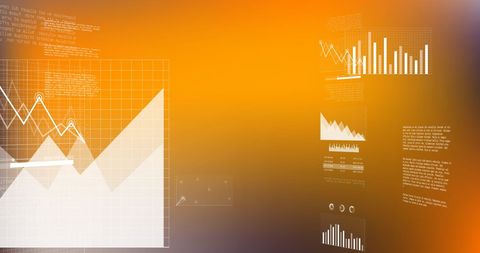
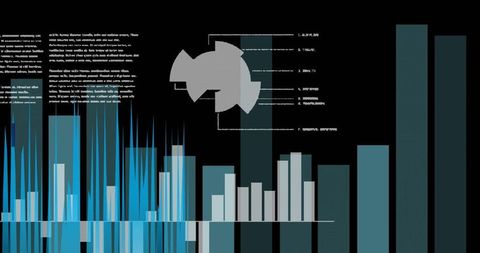
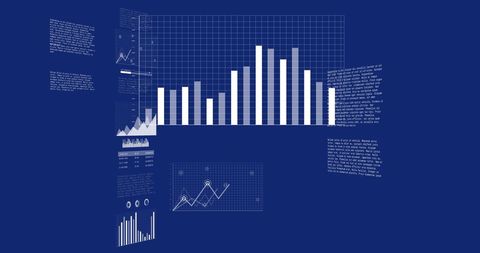
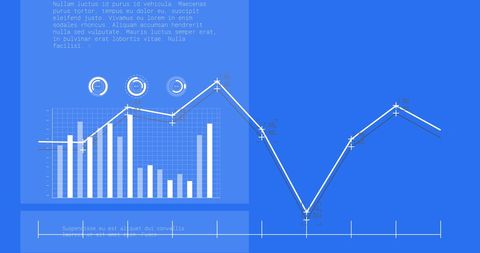
- Futuristic Data Visualization with Digital Graphs and Technology
Futuristic Data Visualization with Digital Graphs and Technology Image
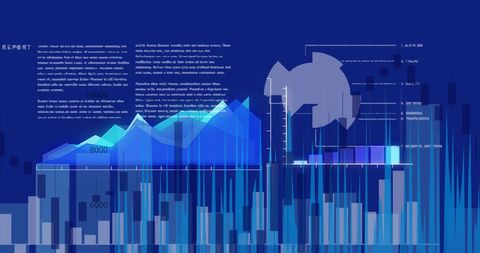
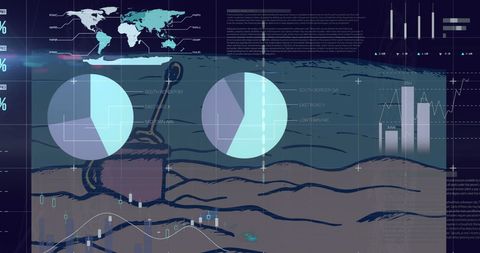
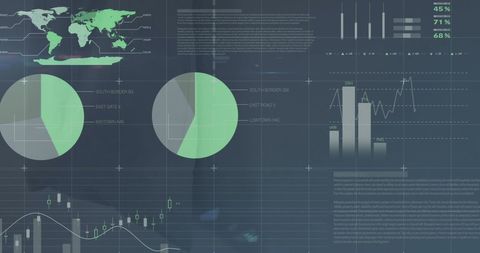
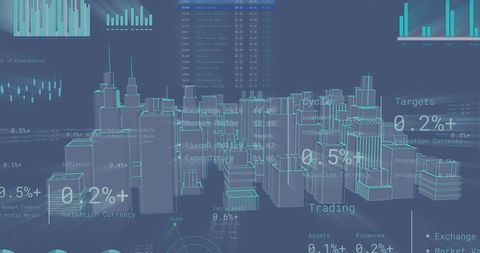
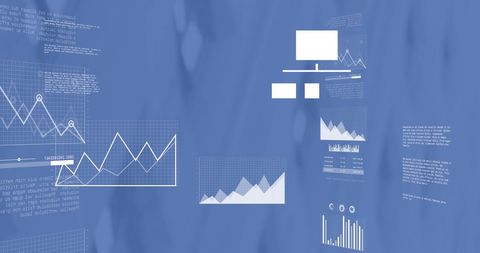
This vector graphic features a futuristic theme of data visualization using multiple graphs and charts against a blue backdrop. Ideal for illustrating modern data processing, tech-driven analytics, dashboard displays, and informative business reports. Suitable for publications on financial analysis, technology-driven presentations, and educational materials.
Powered by 


downloads
Tags:
More
Credit Photo
If you would like to credit the Photo, here are some ways you can do so
Text Link
photo Link
<span class="text-link">
<span>
<a target="_blank" href=https://pikwizard.com/photo/futuristic-data-visualization-with-digital-graphs-and-technology/11c55e135c82a70f6643e0ac903916d9/>PikWizard</a>
</span>
</span>
<span class="image-link">
<span
style="margin: 0 0 20px 0; display: inline-block; vertical-align: middle; width: 100%;"
>
<a
target="_blank"
href="https://pikwizard.com/photo/futuristic-data-visualization-with-digital-graphs-and-technology/11c55e135c82a70f6643e0ac903916d9/"
style="text-decoration: none; font-size: 10px; margin: 0;"
>
<img src="https://pikwizard.com/pw/medium/11c55e135c82a70f6643e0ac903916d9.jpg" style="margin: 0; width: 100%;" alt="" />
<p style="font-size: 12px; margin: 0;">PikWizard</p>
</a>
</span>
</span>
Free (free of charge)
Free for personal and commercial use.
Author: People Creations
Similar Free Stock Images

Premium


Premium

Premium


Premium


Premium


Premium


Premium


Premium

Premium


Premium


Premium


Premium


Premium

Premium


Premium


AI

Premium


Premium


Premium


Premium


Premium

Premium


Premium


Premium

Premium

Premium


Explore More Free Stock Images