
- Home >
- Stock Photos >
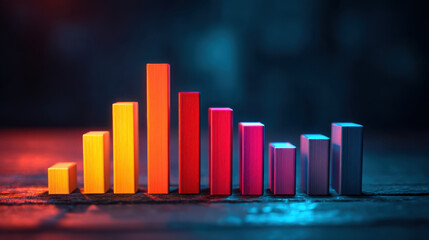
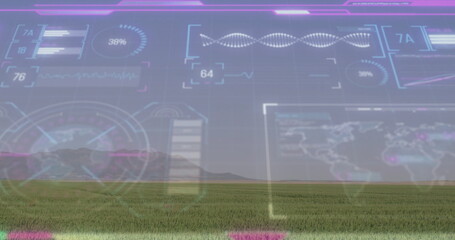
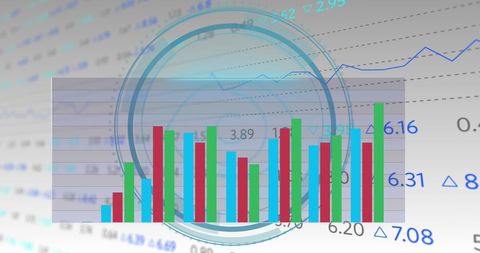
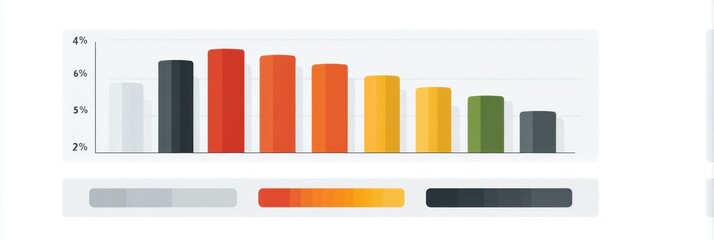
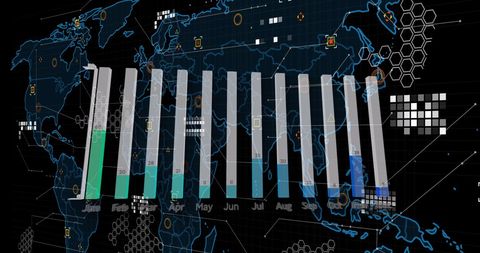
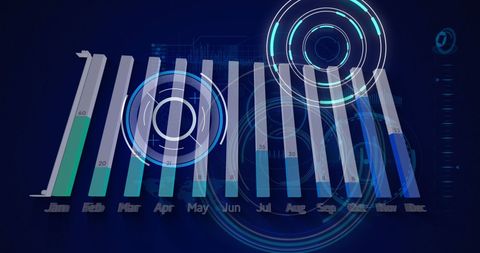
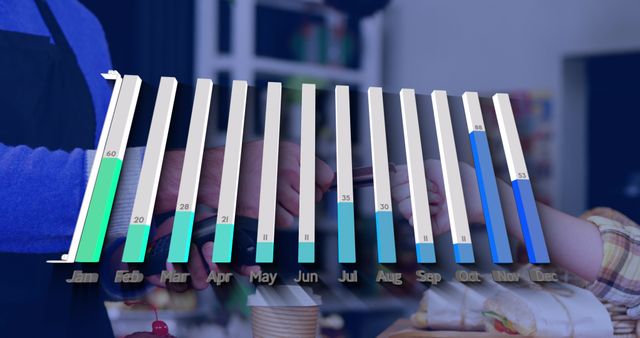
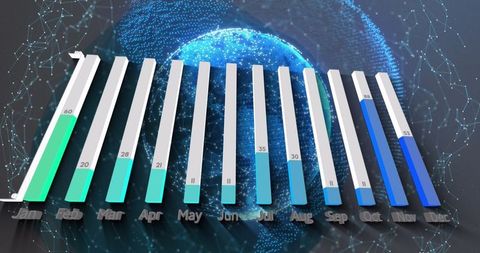
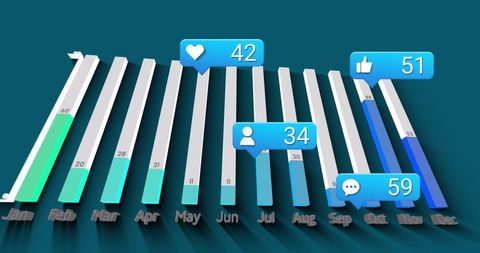
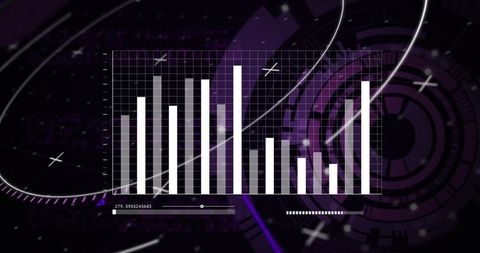
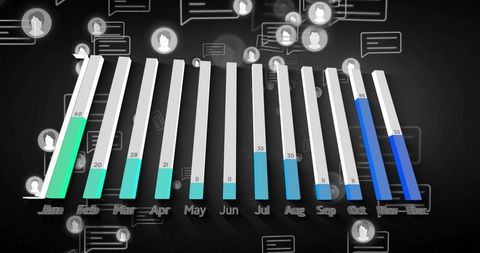
- Futuristic Data Visualization with Digital Scope and Bar Chart
Futuristic Data Visualization with Digital Scope and Bar Chart Image
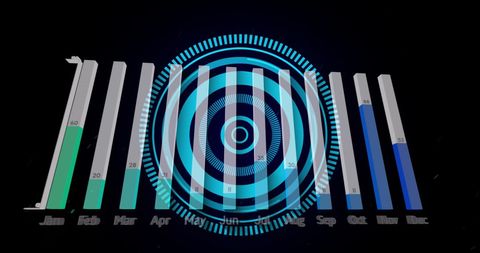
Shows a futuristic data_display featuring glowing bars representing monthly statistical data alongside a digital scanning_scope. Integrate in presentations, business reports, or educational materials to illustrate data_enders with an eye-catching, forward-looking design.
Powered by 


downloads
Tags:
More
Credit Photo
If you would like to credit the Photo, here are some ways you can do so
Text Link
photo Link
<span class="text-link">
<span>
<a target="_blank" href=https://pikwizard.com/photo/futuristic-data-visualization-with-digital-scope-and-bar-chart/58d37339839febd6337130ea282593f8/>PikWizard</a>
</span>
</span>
<span class="image-link">
<span
style="margin: 0 0 20px 0; display: inline-block; vertical-align: middle; width: 100%;"
>
<a
target="_blank"
href="https://pikwizard.com/photo/futuristic-data-visualization-with-digital-scope-and-bar-chart/58d37339839febd6337130ea282593f8/"
style="text-decoration: none; font-size: 10px; margin: 0;"
>
<img src="https://pikwizard.com/pw/medium/58d37339839febd6337130ea282593f8.jpg" style="margin: 0; width: 100%;" alt="" />
<p style="font-size: 12px; margin: 0;">PikWizard</p>
</a>
</span>
</span>
Free (free of charge)
Free for personal and commercial use.
Author: People Creations
Similar Free Stock Images
Premium

Premium
Premium


Premium

Premium

Premium


Premium


Premium

Premium


Premium


Premium


Premium


Premium

Premium

Premium


Premium


Explore More Free Stock Images