
- Home >
- Stock Photos >
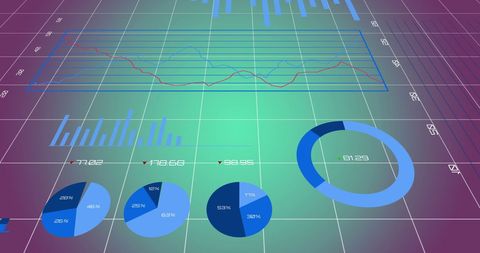
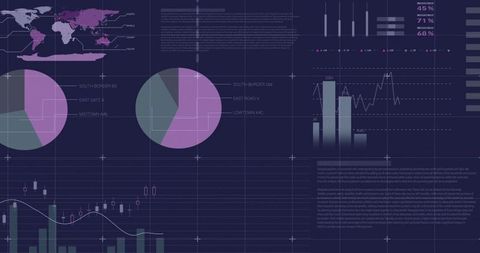
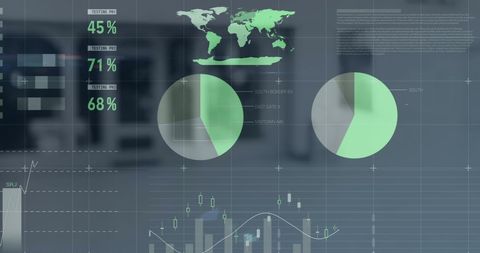
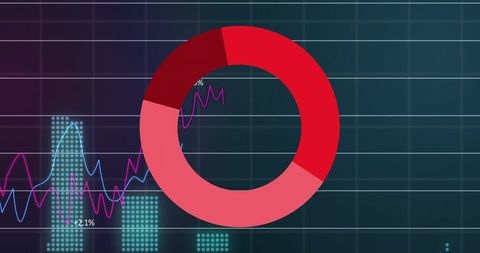
- Futuristic Data Visualization with Donut Chart and Metrics
Futuristic Data Visualization with Donut Chart and Metrics Image
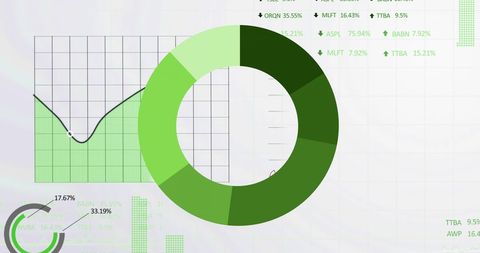
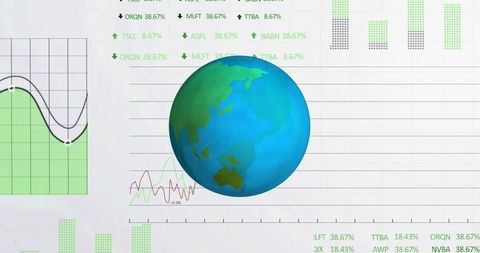
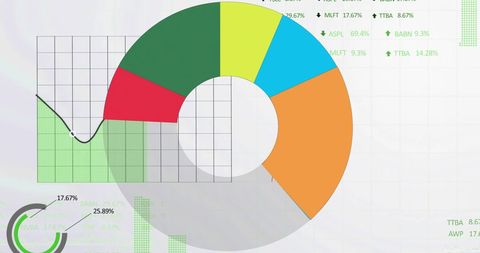
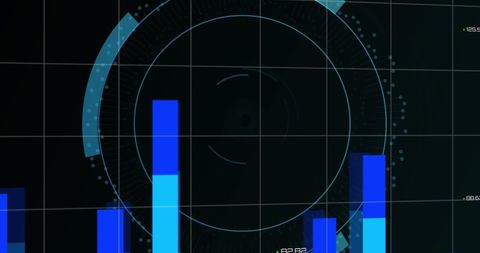
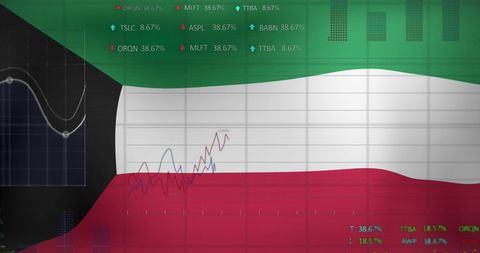
Futuristic data visualization featuring a green donut chart overlayed on a white background with financial metrics and statistics. Ideal for illustrating topics related to global finance, business analytics, data processing, and technological innovation in presentations, reports, or digital content emphasizing data-driven strategy.
Powered by 


downloads
Tags:
More
Credit Photo
If you would like to credit the Photo, here are some ways you can do so
Text Link
photo Link
<span class="text-link">
<span>
<a target="_blank" href=https://pikwizard.com/photo/futuristic-data-visualization-with-donut-chart-and-metrics/507df9edf1bd096bf2b0b84e6953d664/>PikWizard</a>
</span>
</span>
<span class="image-link">
<span
style="margin: 0 0 20px 0; display: inline-block; vertical-align: middle; width: 100%;"
>
<a
target="_blank"
href="https://pikwizard.com/photo/futuristic-data-visualization-with-donut-chart-and-metrics/507df9edf1bd096bf2b0b84e6953d664/"
style="text-decoration: none; font-size: 10px; margin: 0;"
>
<img src="https://pikwizard.com/pw/medium/507df9edf1bd096bf2b0b84e6953d664.jpg" style="margin: 0; width: 100%;" alt="" />
<p style="font-size: 12px; margin: 0;">PikWizard</p>
</a>
</span>
</span>
Free (free of charge)
Free for personal and commercial use.
Author: People Creations
Similar Free Stock Images

Premium

Premium


Premium
Premium


Premium
Premium


Premium


Premium


Premium


Premium
Premium


Premium


Premium


Premium


Premium


Premium


Premium


Premium


Premium


Premium


Premium
Premium


Premium


Premium


Premium


Explore More Free Stock Images