- Home >
- Stock Photos >
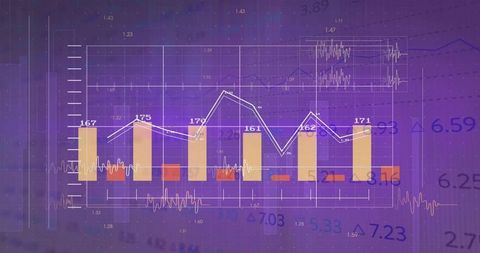
- Futuristic Data Visualization with Dynamic Graphs
Futuristic Data Visualization with Dynamic Graphs Image

Immersive analytics hub showcases motion-based line graphs and bar charts overlaid on a 3D grid background. Depicts a futuristic, abstract take on data presentations, useful for marketing in technology industries, business analytics, and educational text on advanced data processing techniques.

downloads
Tags:
More
Credit Photo
If you would like to credit the Photo, here are some ways you can do so
Text Link
photo Link
<span class="text-link">
<span>
<a target="_blank" href=https://pikwizard.com/photo/futuristic-data-visualization-with-dynamic-graphs/07c483b96d1eee652de26c9bdd3317dc/>PikWizard</a>
</span>
</span>
<span class="image-link">
<span
style="margin: 0 0 20px 0; display: inline-block; vertical-align: middle; width: 100%;"
>
<a
target="_blank"
href="https://pikwizard.com/photo/futuristic-data-visualization-with-dynamic-graphs/07c483b96d1eee652de26c9bdd3317dc/"
style="text-decoration: none; font-size: 10px; margin: 0;"
>
<img src="https://pikwizard.com/pw/medium/07c483b96d1eee652de26c9bdd3317dc.jpg" style="margin: 0; width: 100%;" alt="" />
<p style="font-size: 12px; margin: 0;">PikWizard</p>
</a>
</span>
</span>
Free (free of charge)
Free for personal and commercial use.
Author: Authentic Images