
- Home >
- Stock Photos >
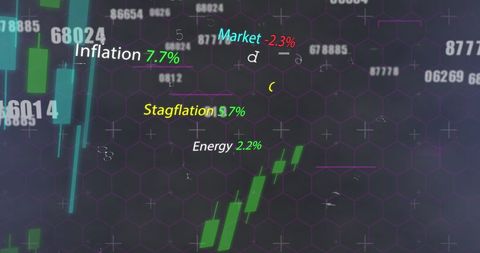
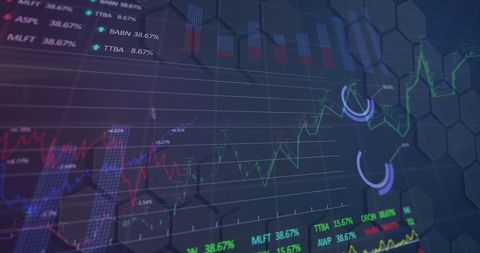
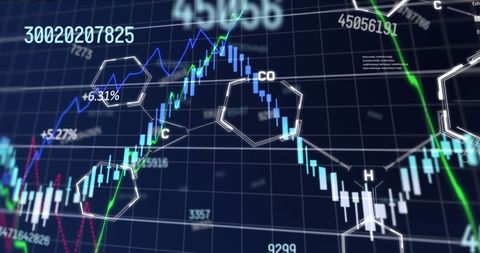
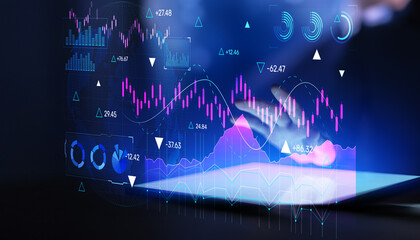
- Futuristic Data Visualization with Financial Metrics
Futuristic Data Visualization with Financial Metrics Image
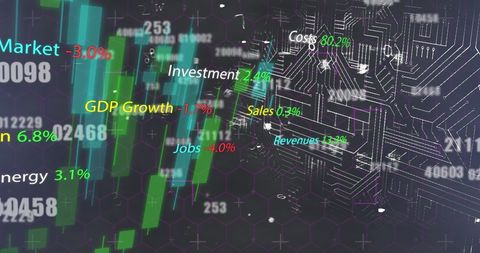
Features dynamic visual representation of financial metrics like investment, GDP growth, and sales. Suitable for presentations on business analytics, economic forecasts, or technology innovations.
Powered by 


downloads
Tags:
More
Credit Photo
If you would like to credit the Photo, here are some ways you can do so
Text Link
photo Link
<span class="text-link">
<span>
<a target="_blank" href=https://pikwizard.com/photo/futuristic-data-visualization-with-financial-metrics/ff8752e34529ee60d5a508158589c22c/>PikWizard</a>
</span>
</span>
<span class="image-link">
<span
style="margin: 0 0 20px 0; display: inline-block; vertical-align: middle; width: 100%;"
>
<a
target="_blank"
href="https://pikwizard.com/photo/futuristic-data-visualization-with-financial-metrics/ff8752e34529ee60d5a508158589c22c/"
style="text-decoration: none; font-size: 10px; margin: 0;"
>
<img src="https://pikwizard.com/pw/medium/ff8752e34529ee60d5a508158589c22c.jpg" style="margin: 0; width: 100%;" alt="" />
<p style="font-size: 12px; margin: 0;">PikWizard</p>
</a>
</span>
</span>
Free (free of charge)
Free for personal and commercial use.
Author: Creative Art
Similar Free Stock Images

Premium


Premium

Premium


Premium

Premium


Premium


Premium


Premium

Premium


Premium
Premium


Premium


Premium


Premium

Premium

Premium


Premium


Premium


Premium


Premium


Premium

Premium

Premium


Premium


Premium

Explore More Free Stock Images