
- Home >
- Stock Photos >
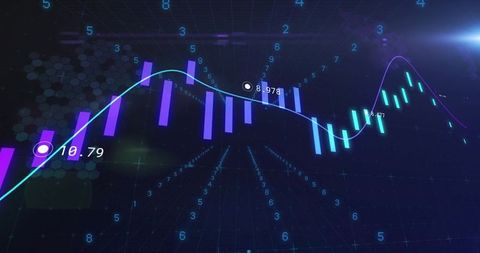
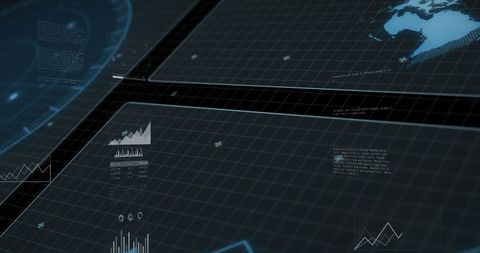
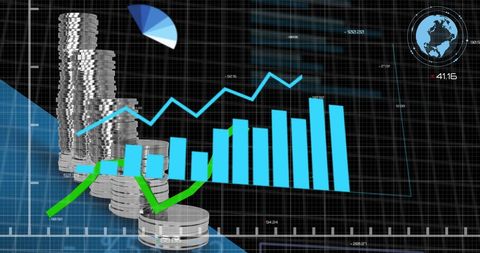
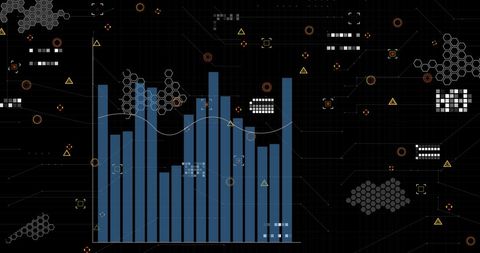
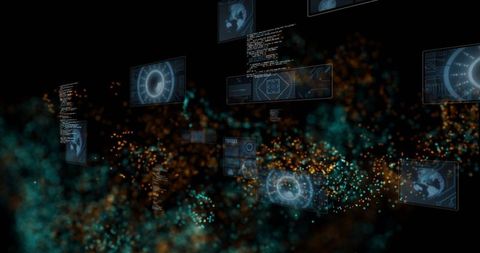
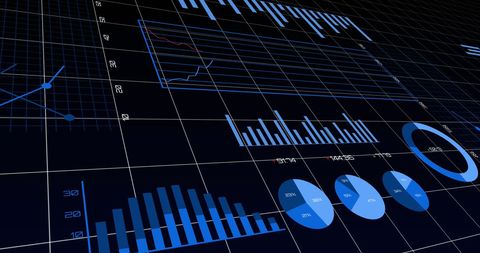
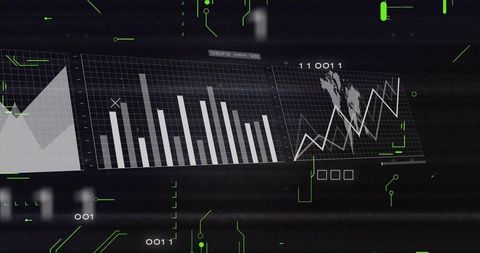
- Futuristic Data Visualization with Floating Charts and Particles
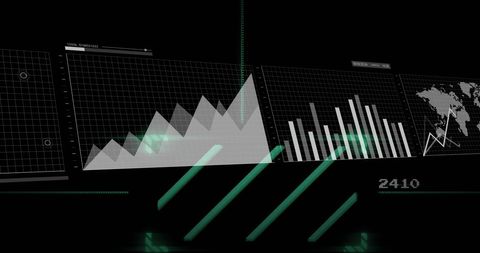
Futuristic Data Visualization with Floating Charts and Particles Image
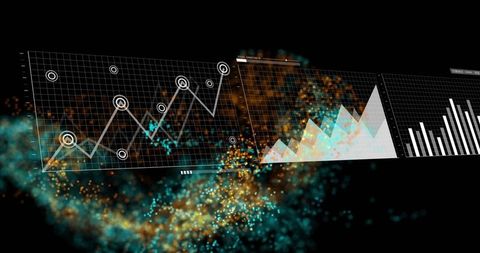
This illustration uses a dark, space-like backdrop with floating digital charts providing analytics and futuristic data presentation. Compelling for presentations on technology advancement and innovative solutions in data analysis. Useful for illustrating concepts in big data, digital technology, or futuristic finance and business conferences.
Powered by 


downloads
Tags:
More
Credit Photo
If you would like to credit the Photo, here are some ways you can do so
Text Link
photo Link
<span class="text-link">
<span>
<a target="_blank" href=https://pikwizard.com/photo/futuristic-data-visualization-with-floating-charts-and-particles/bb7d1da309b693398738d237388d1b25/>PikWizard</a>
</span>
</span>
<span class="image-link">
<span
style="margin: 0 0 20px 0; display: inline-block; vertical-align: middle; width: 100%;"
>
<a
target="_blank"
href="https://pikwizard.com/photo/futuristic-data-visualization-with-floating-charts-and-particles/bb7d1da309b693398738d237388d1b25/"
style="text-decoration: none; font-size: 10px; margin: 0;"
>
<img src="https://pikwizard.com/pw/medium/bb7d1da309b693398738d237388d1b25.jpg" style="margin: 0; width: 100%;" alt="" />
<p style="font-size: 12px; margin: 0;">PikWizard</p>
</a>
</span>
</span>
Free (free of charge)
Free for personal and commercial use.
Author: Authentic Images
Similar Free Stock Images
Premium


Premium

Premium


Premium


Premium

Premium


Premium


Premium


Premium


Premium

Premium

Premium


Premium


Premium


Premium


Premium


Premium


Premium


Premium

Premium


Premium


Premium


Premium


Premium


Premium

Explore More Free Stock Images