
- Home >
- Stock Photos >
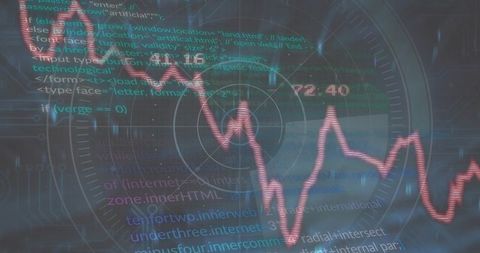
- Futuristic Data Visualization with Fluctuating Line Graph and Digital Interfaces
Futuristic Data Visualization with Fluctuating Line Graph and Digital Interfaces Image
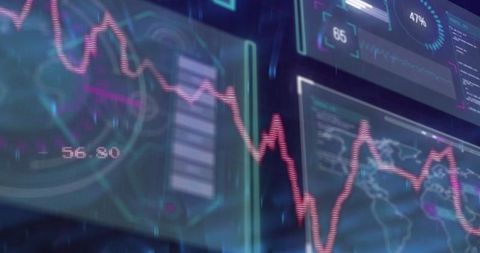
Graphic showing fluctuating line graph on digital panels aligned with futuristic technology theme. Ideal for themes involving data analytics, tech innovations, and cyber visuals.
Powered by 


downloads
Tags:
More
Credit Photo
If you would like to credit the Photo, here are some ways you can do so
Text Link
photo Link
<span class="text-link">
<span>
<a target="_blank" href=https://pikwizard.com/photo/futuristic-data-visualization-with-fluctuating-line-graph-and-digital-interfaces/a4a916741655236da6e9689512df6a64/>PikWizard</a>
</span>
</span>
<span class="image-link">
<span
style="margin: 0 0 20px 0; display: inline-block; vertical-align: middle; width: 100%;"
>
<a
target="_blank"
href="https://pikwizard.com/photo/futuristic-data-visualization-with-fluctuating-line-graph-and-digital-interfaces/a4a916741655236da6e9689512df6a64/"
style="text-decoration: none; font-size: 10px; margin: 0;"
>
<img src="https://pikwizard.com/pw/medium/a4a916741655236da6e9689512df6a64.jpg" style="margin: 0; width: 100%;" alt="" />
<p style="font-size: 12px; margin: 0;">PikWizard</p>
</a>
</span>
</span>
Free (free of charge)
Free for personal and commercial use.
Author: Authentic Images
Similar Free Stock Images

Premium


Premium

Premium


Premium


Premium


Premium


Premium


Premium

Premium

Premium

Premium


Premium


Premium


Premium


Premium


Premium


Premium


Premium


Premium


Premium


Premium


Premium


Premium


Premium


Premium
Explore More Free Stock Images