- Home >
- Stock Photos >
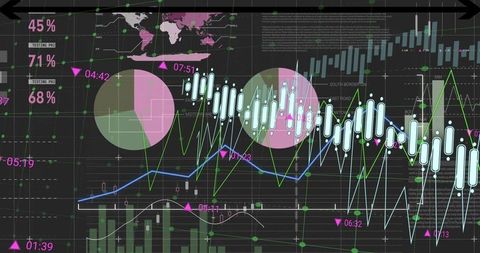
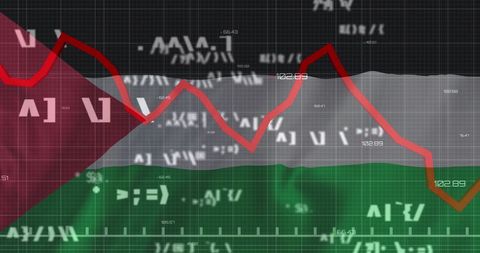
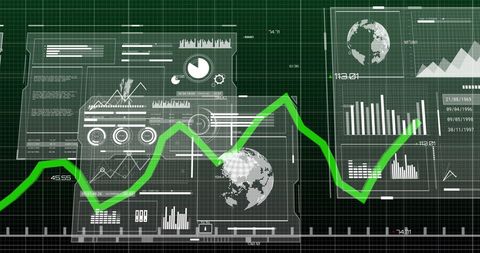
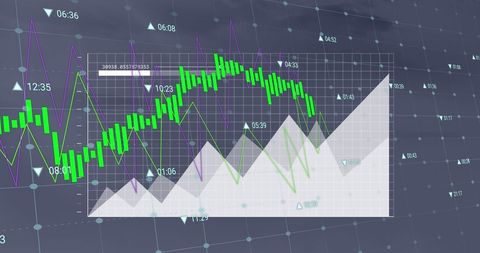
- Futuristic Data Visualization with Global Analytics Interface
Futuristic Data Visualization with Global Analytics Interface Image
Modern digital interface showcasing a collection of charts and graphs including area, line, and bar formats against a global map. Ideal for technology and finance-related uses, this visualization can illustrate market trends, explain complex data analytics, or be featured in reports and presentations for stakeholders interested in visual data insights.

downloads
Tags:
More
Credit Photo
If you would like to credit the Photo, here are some ways you can do so
Text Link
photo Link
<span class="text-link">
<span>
<a target="_blank" href=https://pikwizard.com/photo/futuristic-data-visualization-with-global-analytics-interface/b0ad0cc621edc68c8b05005eddb6fdbd/>PikWizard</a>
</span>
</span>
<span class="image-link">
<span
style="margin: 0 0 20px 0; display: inline-block; vertical-align: middle; width: 100%;"
>
<a
target="_blank"
href="https://pikwizard.com/photo/futuristic-data-visualization-with-global-analytics-interface/b0ad0cc621edc68c8b05005eddb6fdbd/"
style="text-decoration: none; font-size: 10px; margin: 0;"
>
<img src="https://pikwizard.com/pw/medium/b0ad0cc621edc68c8b05005eddb6fdbd.jpg" style="margin: 0; width: 100%;" alt="" />
<p style="font-size: 12px; margin: 0;">PikWizard</p>
</a>
</span>
</span>
Free (free of charge)
Free for personal and commercial use.
Author: People Creations