
- Home >
- Stock Photos >
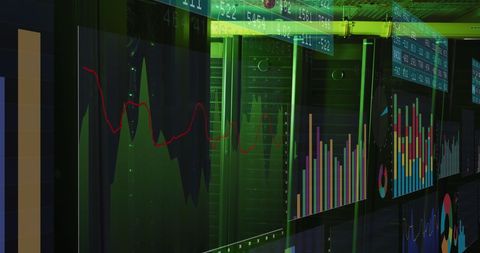
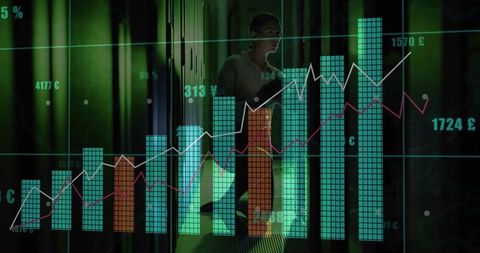
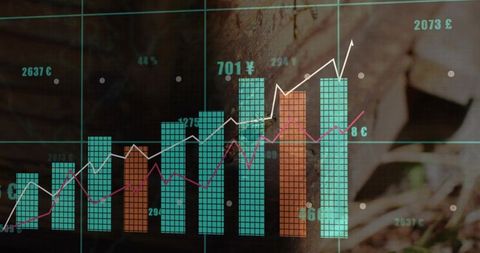
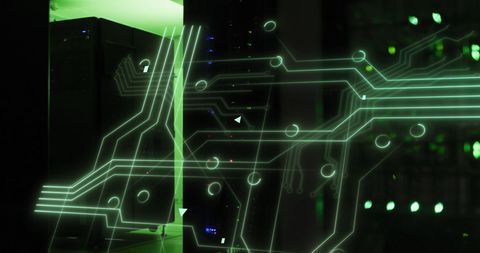
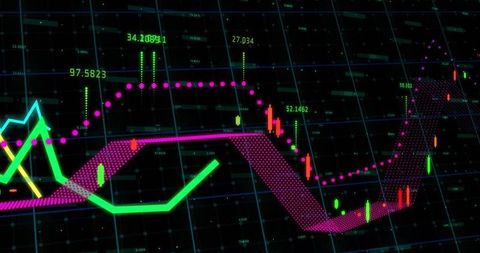
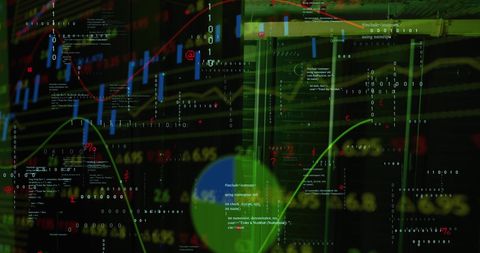
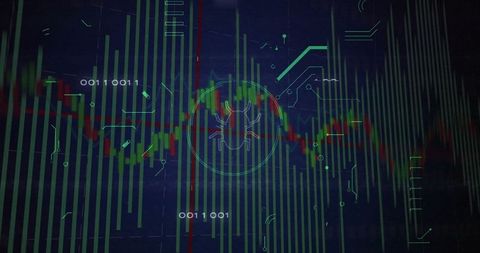
- Futuristic Data Visualization with Graph Overlay in Green-Lit Server Room
Futuristic Data Visualization with Graph Overlay in Green-Lit Server Room Image
Scene combining technology and finance concepts through vivid data visualizations overlaying equipped server room with green lighting. Bars and graphs portray statistics and trends useful for tech, financial strategies, or business analysis visuals. Ideal for illustrating digital transformation, innovations analyses, and resources in presentations and reports.
Powered by  - Get 15% off with code: PIKWIZARD15


downloads
Tags:
More
Credit Photo
If you would like to credit the Photo, here are some ways you can do so
Text Link
photo Link
<span class="text-link">
<span>
<a target="_blank" href=https://pikwizard.com/photo/futuristic-data-visualization-with-graph-overlay-in-green-lit-server-room/74c520525fbc7a142172ed41bfa8c7d4/>PikWizard</a>
</span>
</span>
<span class="image-link">
<span
style="margin: 0 0 20px 0; display: inline-block; vertical-align: middle; width: 100%;"
>
<a
target="_blank"
href="https://pikwizard.com/photo/futuristic-data-visualization-with-graph-overlay-in-green-lit-server-room/74c520525fbc7a142172ed41bfa8c7d4/"
style="text-decoration: none; font-size: 10px; margin: 0;"
>
<img src="https://pikwizard.com/pw/medium/74c520525fbc7a142172ed41bfa8c7d4.jpg" style="margin: 0; width: 100%;" alt="" />
<p style="font-size: 12px; margin: 0;">PikWizard</p>
</a>
</span>
</span>
Free (free of charge)
Free for personal and commercial use.
Author: Authentic Images
Similar Free Stock Images

Premium


Premium

Premium


Premium


Premium


Premium


Premium


Premium


Premium


Premium


Premium


Premium


Premium


Premium


Premium


Premium


Premium


Premium


Premium


Premium

Premium


Premium


Premium


Premium


Premium


Explore More Free Stock Images