
- Home >
- Stock Photos >
- Futuristic Data Visualization with Graphs and Analytics Interface
Futuristic Data Visualization with Graphs and Analytics Interface Image

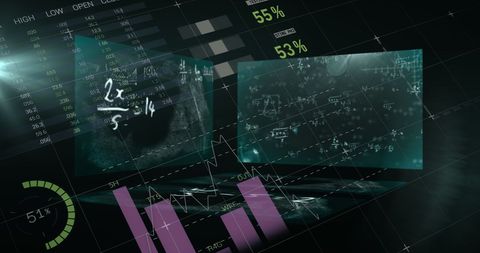
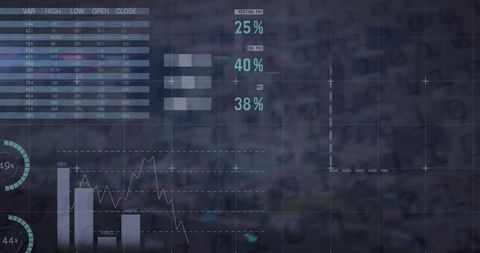
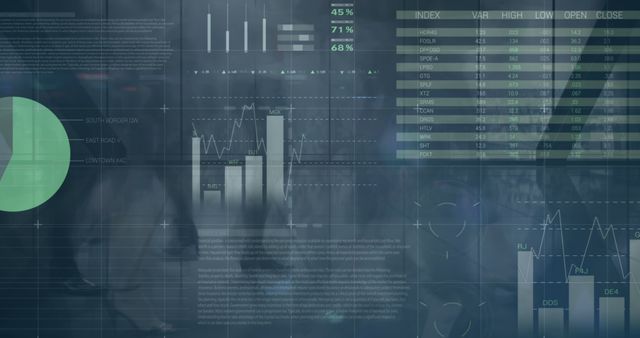
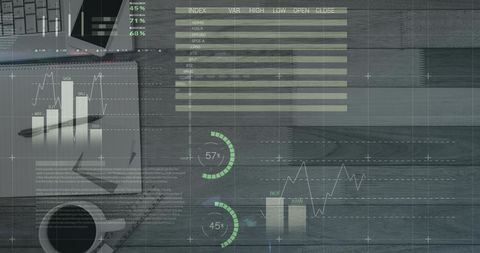
This digital visualization shows a futuristic interface combining numerous graphs and charts depicting statistical data. Mathematical equations float prominently, representing advanced analytical processing. Ideal for use in content related to technology, data analytics, digital transformation, and financial forecasting materials. It underscores themes of precision, innovation, and cutting-edge technologies.
Powered by  - Get 15% off with code: PIKWIZARD15


downloads
Tags:
More
Credit Photo
If you would like to credit the Photo, here are some ways you can do so
Text Link
photo Link
<span class="text-link">
<span>
<a target="_blank" href=https://pikwizard.com/photo/futuristic-data-visualization-with-graphs-and-analytics-interface/8b6989c1a189b8a6c3b905b217823543/>PikWizard</a>
</span>
</span>
<span class="image-link">
<span
style="margin: 0 0 20px 0; display: inline-block; vertical-align: middle; width: 100%;"
>
<a
target="_blank"
href="https://pikwizard.com/photo/futuristic-data-visualization-with-graphs-and-analytics-interface/8b6989c1a189b8a6c3b905b217823543/"
style="text-decoration: none; font-size: 10px; margin: 0;"
>
<img src="https://pikwizard.com/pw/medium/8b6989c1a189b8a6c3b905b217823543.jpg" style="margin: 0; width: 100%;" alt="" />
<p style="font-size: 12px; margin: 0;">PikWizard</p>
</a>
</span>
</span>
Free (free of charge)
Free for personal and commercial use.
Author: Creative Art
Similar Free Stock Images

Premium


Premium


Premium


Premium


Premium


Premium

Premium


Premium


Premium

Premium


Premium


Premium


Premium


Premium


Premium


Premium


Premium


Premium


Premium


Premium


Premium


Premium


Premium


Premium


Premium

Explore More Free Stock Images