
- Home >
- Stock Photos >
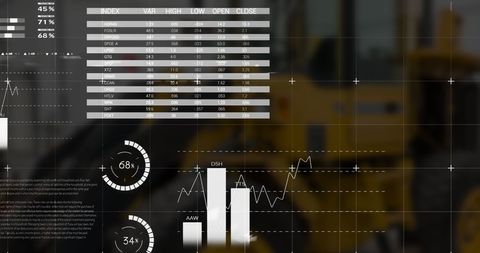
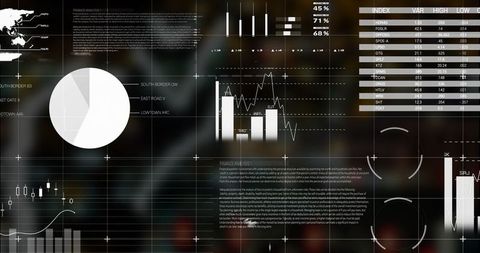
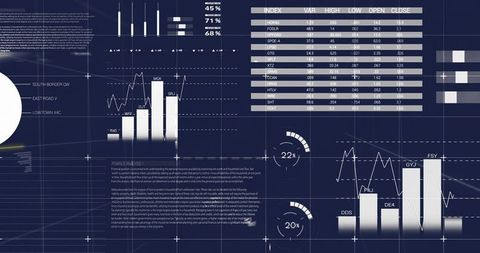
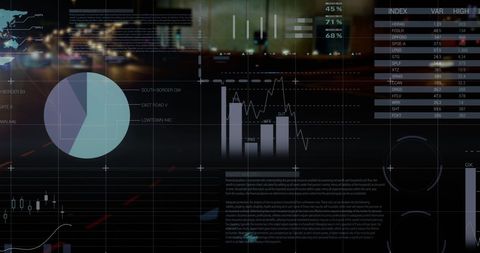
- Futuristic Data Visualization with Graphs and Charts
Futuristic Data Visualization with Graphs and Charts Image

Complex data visualization combines maps, graphs, and charts on a dark backdrop, offering a sophisticated view of business analytics and technology. Useful for presentations or articles focusing on data analytics, technology in business, or modern interface design.
Powered by  - Get 15% off with code: PIKWIZARD15


downloads
Tags:
More
Credit Photo
If you would like to credit the Photo, here are some ways you can do so
Text Link
photo Link
<span class="text-link">
<span>
<a target="_blank" href=https://pikwizard.com/photo/futuristic-data-visualization-with-graphs-and-charts/1a301d0ffaf1ea6ecdfe50a58ae4acf5/>PikWizard</a>
</span>
</span>
<span class="image-link">
<span
style="margin: 0 0 20px 0; display: inline-block; vertical-align: middle; width: 100%;"
>
<a
target="_blank"
href="https://pikwizard.com/photo/futuristic-data-visualization-with-graphs-and-charts/1a301d0ffaf1ea6ecdfe50a58ae4acf5/"
style="text-decoration: none; font-size: 10px; margin: 0;"
>
<img src="https://pikwizard.com/pw/medium/1a301d0ffaf1ea6ecdfe50a58ae4acf5.jpg" style="margin: 0; width: 100%;" alt="" />
<p style="font-size: 12px; margin: 0;">PikWizard</p>
</a>
</span>
</span>
Free (free of charge)
Free for personal and commercial use.
Author: Creative Art
Similar Free Stock Images

Premium


Premium


Premium


Premium


Premium


Premium


Premium

Premium

Premium


Premium

Premium


Premium


Premium


Premium

Premium


Premium


Premium


Premium


Premium


Premium


Premium


Premium

Premium


Premium


Premium


Explore More Free Stock Images