- Home >
- Stock Photos >
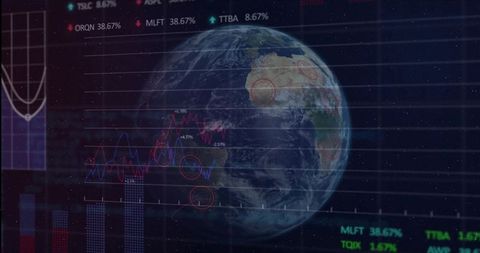
- Futuristic Data Visualization with Graphs and Code
Futuristic Data Visualization with Graphs and Code Image

Visual representation depicts futuristic data visualization dashboard merging graphical analytics with complex code overlays. This design can illustrate cutting-edge technological advancements central to sectors focusing on analytics or cybersecurity. Ideal for digital transformation projects or articles emphasizing modern conformities in data handling.

downloads
Tags:
More
Credit Photo
If you would like to credit the Photo, here are some ways you can do so
Text Link
photo Link
<span class="text-link">
<span>
<a target="_blank" href=https://pikwizard.com/photo/futuristic-data-visualization-with-graphs-and-code/bea7448b341d7929f63278dff6490a54/>PikWizard</a>
</span>
</span>
<span class="image-link">
<span
style="margin: 0 0 20px 0; display: inline-block; vertical-align: middle; width: 100%;"
>
<a
target="_blank"
href="https://pikwizard.com/photo/futuristic-data-visualization-with-graphs-and-code/bea7448b341d7929f63278dff6490a54/"
style="text-decoration: none; font-size: 10px; margin: 0;"
>
<img src="https://pikwizard.com/pw/medium/bea7448b341d7929f63278dff6490a54.jpg" style="margin: 0; width: 100%;" alt="" />
<p style="font-size: 12px; margin: 0;">PikWizard</p>
</a>
</span>
</span>
Free (free of charge)
Free for personal and commercial use.
Author: Creative Art