
- Home >
- Stock Photos >
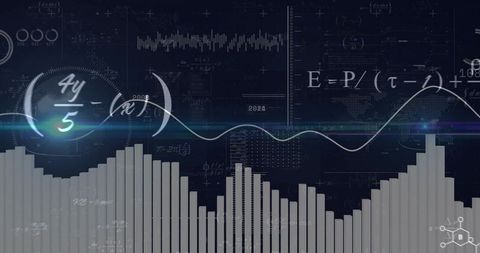
- Futuristic Data Visualization with Graphs and Gauges
Futuristic Data Visualization with Graphs and Gauges Image

Futuristic visualization concept displaying white bar charts combined with dynamic line graphs and radial gauges against a digital interface. This image typifies the presentation of complex data analytics and technological advancements. Suitable for use in business reports, technology content marketing, analytics training material, or visualization design templates for showcasing innovations in data interpretation.
Powered by  - Get 15% off with code: PIKWIZARD15


downloads
Tags:
More
Credit Photo
If you would like to credit the Photo, here are some ways you can do so
Text Link
photo Link
<span class="text-link">
<span>
<a target="_blank" href=https://pikwizard.com/photo/futuristic-data-visualization-with-graphs-and-gauges/1d8b36eb7a33da6ce89df3c815c20ae0/>PikWizard</a>
</span>
</span>
<span class="image-link">
<span
style="margin: 0 0 20px 0; display: inline-block; vertical-align: middle; width: 100%;"
>
<a
target="_blank"
href="https://pikwizard.com/photo/futuristic-data-visualization-with-graphs-and-gauges/1d8b36eb7a33da6ce89df3c815c20ae0/"
style="text-decoration: none; font-size: 10px; margin: 0;"
>
<img src="https://pikwizard.com/pw/medium/1d8b36eb7a33da6ce89df3c815c20ae0.jpg" style="margin: 0; width: 100%;" alt="" />
<p style="font-size: 12px; margin: 0;">PikWizard</p>
</a>
</span>
</span>
Free (free of charge)
Free for personal and commercial use.
Author: Awesome Content
Similar Free Stock Images

Premium


Premium


Premium

Premium


Premium


Premium

Premium

Premium

Premium


Premium


Premium

Premium


Premium

Premium

Premium


Premium


Premium

Premium


Premium


Premium


Premium


Premium


Premium

Premium


Premium


Explore More Free Stock Images