
- Home >
- Stock Photos >
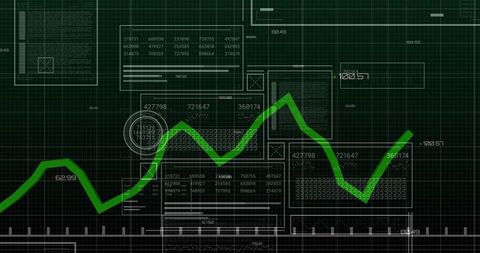
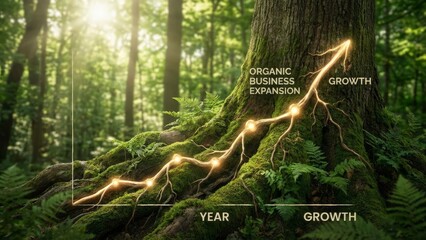
- Futuristic Data Visualization with Green Line Graph and Analytics Interface
Futuristic Data Visualization with Green Line Graph and Analytics Interface Image

Showcases futuristic data visualization with a green line graph on a digital interface. Ideal for concepts of analytics, technology advancements, and information systems. Useful for websites and presentations focusing on growth, statistical analysis, or digital transformations.
Powered by 


downloads
Tags:
More
Credit Photo
If you would like to credit the Photo, here are some ways you can do so
Text Link
photo Link
<span class="text-link">
<span>
<a target="_blank" href=https://pikwizard.com/photo/futuristic-data-visualization-with-green-line-graph-and-analytics-interface/7397177d294b05a881576f4190b042a4/>PikWizard</a>
</span>
</span>
<span class="image-link">
<span
style="margin: 0 0 20px 0; display: inline-block; vertical-align: middle; width: 100%;"
>
<a
target="_blank"
href="https://pikwizard.com/photo/futuristic-data-visualization-with-green-line-graph-and-analytics-interface/7397177d294b05a881576f4190b042a4/"
style="text-decoration: none; font-size: 10px; margin: 0;"
>
<img src="https://pikwizard.com/pw/medium/7397177d294b05a881576f4190b042a4.jpg" style="margin: 0; width: 100%;" alt="" />
<p style="font-size: 12px; margin: 0;">PikWizard</p>
</a>
</span>
</span>
Free (free of charge)
Free for personal and commercial use.
Author: Authentic Images
Similar Free Stock Images

Premium


Premium

Premium


Premium


Premium


Premium


Premium


Premium


Premium


Premium


Premium


Premium


Premium

Premium

Premium


Premium


Premium


Premium


AI

Premium

AI


Premium


Premium


Premium


Premium


AI


Premium

Premium


Explore More Free Stock Images