
- Home >
- Free Stock Photos & Images >
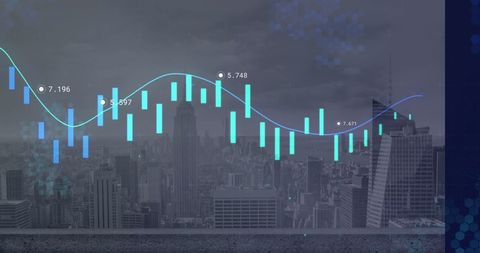
- Futuristic Data Visualization with Highlighted Analytics Trends
Futuristic Data Visualization with Highlighted Analytics Trends Free Stock Image

A sleek and modern digital graphic showcasing a bar-line chart with highlighted data points on a grid. It represents modern data analytics with a focus on trends and insights. Ideal for digital projects, presentations, and articles related to data science, financial forecasts, or technology development.
Powered by  - Get 15% off with code: PIKWIZARD15


downloads
Tags:
More
Credit Photo
If you would like to credit the Photo, here are some ways you can do so
Text Link
photo Link
<span class="text-link">
<span>
<a target="_blank" href=https://pikwizard.com/photo/futuristic-data-visualization-with-highlighted-analytics-trends/0d6359aeceff26daac993d0bedcfa71e/>PikWizard</a>
</span>
</span>
<span class="image-link">
<span
style="margin: 0 0 20px 0; display: inline-block; vertical-align: middle; width: 100%;"
>
<a
target="_blank"
href="https://pikwizard.com/photo/futuristic-data-visualization-with-highlighted-analytics-trends/0d6359aeceff26daac993d0bedcfa71e/"
style="text-decoration: none; font-size: 10px; margin: 0;"
>
<img src="https://thumbs.wbm.im/pw/medium/0d6359aeceff26daac993d0bedcfa71e.jpg" style="margin: 0; width: 100%;" alt="Futuristic Data Visualization with Highlighted Analytics Trends" />
<p style="font-size: 12px; margin: 0;">PikWizard</p>
</a>
</span>
</span>
Free (free of charge)
Free for personal and commercial use.
Author: Creative Art
Similar Free Stock Images


Premium


Premium


Premium


Premium


Premium


Premium


Premium


Premium


Premium


Premium


Premium


Premium


Premium


Premium


Premium


Premium


Premium


Premium


Premium


Premium


Premium


Premium


Premium


Premium


Premium

Explore More Free Stock Images