
- Home >
- Stock Photos >
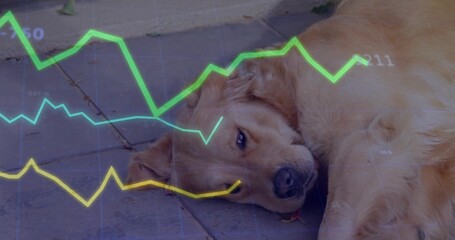
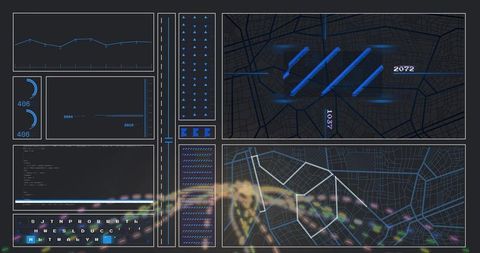
- Futuristic Data Visualization with Interactive Charts and Numbers
Futuristic Data Visualization with Interactive Charts and Numbers Image

Illustrates cutting-edge data analysis and technology concepts, suitable for themes of business intelligence, technological advancements, and corporate growth. Ideal for use in presentations, marketing materials, or articles focused on data-driven decision-making or digital transformation.
Powered by 


downloads
Tags:
More
Credit Photo
If you would like to credit the Photo, here are some ways you can do so
Text Link
photo Link
<span class="text-link">
<span>
<a target="_blank" href=https://pikwizard.com/photo/futuristic-data-visualization-with-interactive-charts-and-numbers/4dca605363a1b39a6bb4bb0ec2a7b221/>PikWizard</a>
</span>
</span>
<span class="image-link">
<span
style="margin: 0 0 20px 0; display: inline-block; vertical-align: middle; width: 100%;"
>
<a
target="_blank"
href="https://pikwizard.com/photo/futuristic-data-visualization-with-interactive-charts-and-numbers/4dca605363a1b39a6bb4bb0ec2a7b221/"
style="text-decoration: none; font-size: 10px; margin: 0;"
>
<img src="https://pikwizard.com/pw/medium/4dca605363a1b39a6bb4bb0ec2a7b221.jpg" style="margin: 0; width: 100%;" alt="" />
<p style="font-size: 12px; margin: 0;">PikWizard</p>
</a>
</span>
</span>
Free (free of charge)
Free for personal and commercial use.
Author: Creative Art
Similar Free Stock Images

Premium


Premium


Premium


Premium


Premium

Premium


Premium


Premium

Premium

Premium


Premium


Premium


Premium


Premium


Premium

Premium


Premium


Premium


Premium


Premium


Premium


Premium


Premium


Premium


Premium

Explore More Free Stock Images