- Home >
- Stock Photos >
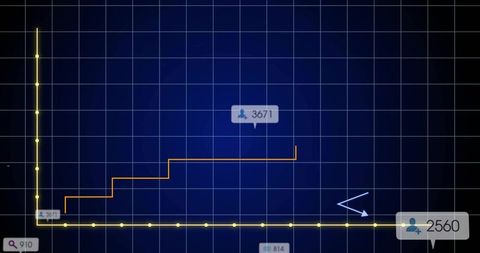
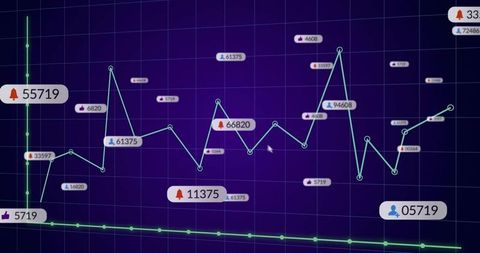
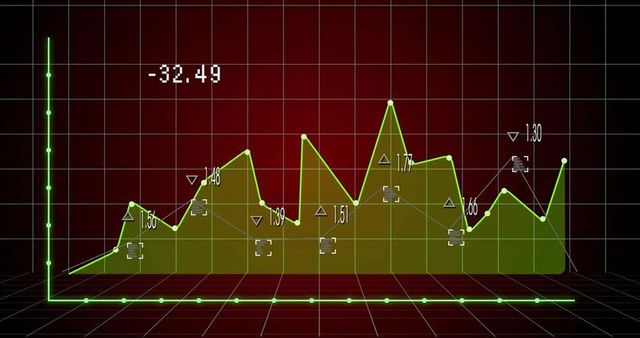
- Futuristic Data Visualization with Interactive Chat Elements
Futuristic Data Visualization with Interactive Chat Elements Image

This concept highlights a blend of interactive chat functions with graphical data to portray marketing trends, business analytics, or tech media interfaces. Suited for presentations in business, technology, marketing strategy concepts, and education on digital platforms to engage users in understanding data effectively. Encourages user involvement through a visually engaging design, showcasing innovation at the intersection of communication and analytical technology.

downloads
Tags:
More
Credit Photo
If you would like to credit the Photo, here are some ways you can do so
Text Link
photo Link
<span class="text-link">
<span>
<a target="_blank" href=https://pikwizard.com/photo/futuristic-data-visualization-with-interactive-chat-elements/322cd03396e931cd2a9804acaca2bf42/>PikWizard</a>
</span>
</span>
<span class="image-link">
<span
style="margin: 0 0 20px 0; display: inline-block; vertical-align: middle; width: 100%;"
>
<a
target="_blank"
href="https://pikwizard.com/photo/futuristic-data-visualization-with-interactive-chat-elements/322cd03396e931cd2a9804acaca2bf42/"
style="text-decoration: none; font-size: 10px; margin: 0;"
>
<img src="https://pikwizard.com/pw/medium/322cd03396e931cd2a9804acaca2bf42.jpg" style="margin: 0; width: 100%;" alt="" />
<p style="font-size: 12px; margin: 0;">PikWizard</p>
</a>
</span>
</span>
Free (free of charge)
Free for personal and commercial use.
Author: People Creations