
- Home >
- Stock Photos >
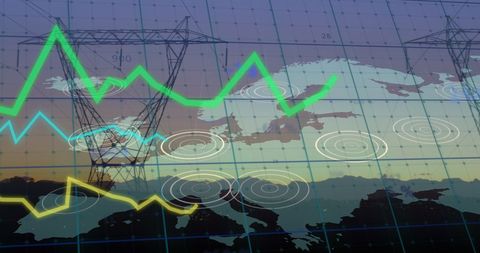
- Futuristic Data Visualization with Interactive Line Graph and World Maps
Futuristic Data Visualization with Interactive Line Graph and World Maps Image

This digital scene features a green line graph set against a purple grid backdrop, along with abstract radar circles and faint world map silhouettes. It embodies modern technology concepts and can be useful for slide presentations, tech blogs, or business reports showcasing data-driven solutions. Perfect for illustrating key performance indicators in tech-driven industries or visual mapping of statistics across global markets.
Powered by  - Get 15% off with code: PIKWIZARD15


downloads
Tags:
More
Credit Photo
If you would like to credit the Photo, here are some ways you can do so
Text Link
photo Link
<span class="text-link">
<span>
<a target="_blank" href=https://pikwizard.com/photo/futuristic-data-visualization-with-interactive-line-graph-and-world-maps/a3e2281f91acb45fe8fa080901594fae/>PikWizard</a>
</span>
</span>
<span class="image-link">
<span
style="margin: 0 0 20px 0; display: inline-block; vertical-align: middle; width: 100%;"
>
<a
target="_blank"
href="https://pikwizard.com/photo/futuristic-data-visualization-with-interactive-line-graph-and-world-maps/a3e2281f91acb45fe8fa080901594fae/"
style="text-decoration: none; font-size: 10px; margin: 0;"
>
<img src="https://pikwizard.com/pw/medium/a3e2281f91acb45fe8fa080901594fae.jpg" style="margin: 0; width: 100%;" alt="" />
<p style="font-size: 12px; margin: 0;">PikWizard</p>
</a>
</span>
</span>
Free (free of charge)
Free for personal and commercial use.
Author: People Creations
Similar Free Stock Images

Premium


Premium


Premium

Premium


Premium


Premium


Premium


Premium


Premium


Premium

Premium


Premium


Premium


Premium

Premium


Premium

Premium


Premium


Premium


Premium


Premium

Premium

Premium


Premium


Premium


Explore More Free Stock Images