
- Home >
- Stock Photos >
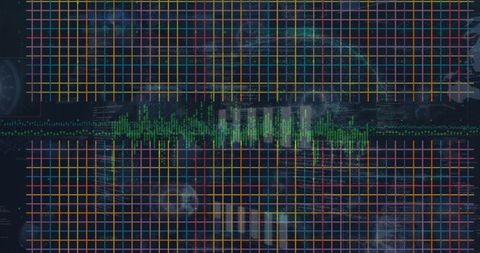
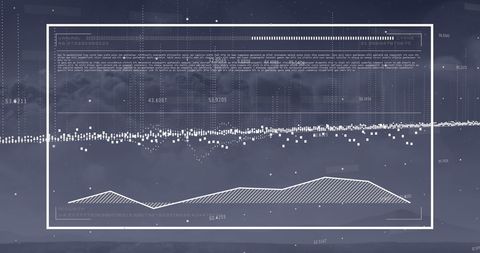
- Futuristic Data Visualization with Layered Area Graphs and Glowing Nodes
Futuristic Data Visualization with Layered Area Graphs and Glowing Nodes Image
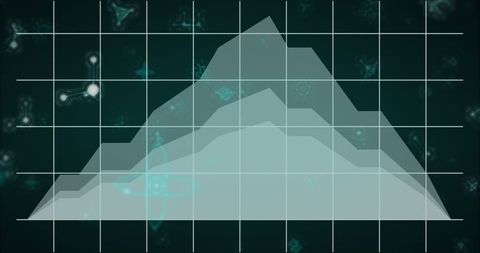
Digital illustration featuring layered area graphs rising and falling against a dark teal background with a grid and glowing nodes. Captures essence of advanced analytics and technology. Useful for businesses and reports focusing on data trends, infographics, dashboards, and information science or presentations requiring a sophisticated and futuristic outlook.
Powered by 


downloads
Tags:
More
Credit Photo
If you would like to credit the Photo, here are some ways you can do so
Text Link
photo Link
<span class="text-link">
<span>
<a target="_blank" href=https://pikwizard.com/photo/futuristic-data-visualization-with-layered-area-graphs-and-glowing-nodes/e6e8e0fb3fe9a5e671fa569f693aae95/>PikWizard</a>
</span>
</span>
<span class="image-link">
<span
style="margin: 0 0 20px 0; display: inline-block; vertical-align: middle; width: 100%;"
>
<a
target="_blank"
href="https://pikwizard.com/photo/futuristic-data-visualization-with-layered-area-graphs-and-glowing-nodes/e6e8e0fb3fe9a5e671fa569f693aae95/"
style="text-decoration: none; font-size: 10px; margin: 0;"
>
<img src="https://pikwizard.com/pw/medium/e6e8e0fb3fe9a5e671fa569f693aae95.jpg" style="margin: 0; width: 100%;" alt="" />
<p style="font-size: 12px; margin: 0;">PikWizard</p>
</a>
</span>
</span>
Free (free of charge)
Free for personal and commercial use.
Author: Awesome Content
Similar Free Stock Images

Premium


Premium

Premium


Premium


Premium


Premium


Premium


Premium


Premium

Premium

Premium


Premium
Premium


Premium

Premium


Premium


Premium


Premium


Premium


Premium


Premium


Premium


Premium

Premium


Premium


Explore More Free Stock Images