
- Home >
- Stock Photos >
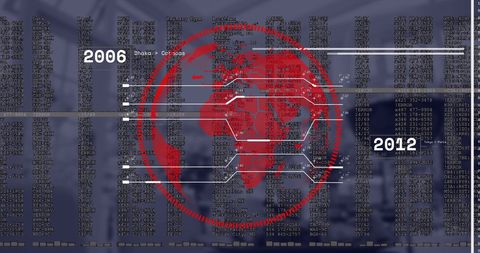
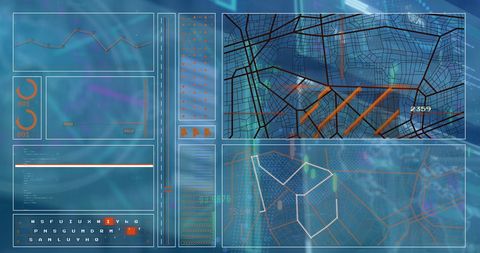
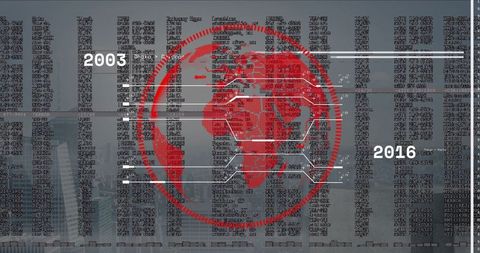
- Futuristic Data Visualization with Map and Code Interface
Futuristic Data Visualization with Map and Code Interface Image

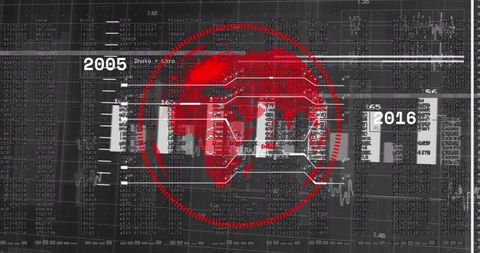
Digital interface features a red map overlaying streams of code, accompanied by HUD elements and timeline markers from 2008 to 2012. Technology-focused visuals utilizing futuristic themes, exhibiting control over complex data systems. Perfect for articles or projects relating to tech evolution, surveillance systems, data analytics, digital transformation, or sci-fi themes.
Powered by  - Get 15% off with code: PIKWIZARD15


downloads
Tags:
More
Credit Photo
If you would like to credit the Photo, here are some ways you can do so
Text Link
photo Link
<span class="text-link">
<span>
<a target="_blank" href=https://pikwizard.com/photo/futuristic-data-visualization-with-map-and-code-interface/50187415c0fda1809573e0aa87301e28/>PikWizard</a>
</span>
</span>
<span class="image-link">
<span
style="margin: 0 0 20px 0; display: inline-block; vertical-align: middle; width: 100%;"
>
<a
target="_blank"
href="https://pikwizard.com/photo/futuristic-data-visualization-with-map-and-code-interface/50187415c0fda1809573e0aa87301e28/"
style="text-decoration: none; font-size: 10px; margin: 0;"
>
<img src="https://pikwizard.com/pw/medium/50187415c0fda1809573e0aa87301e28.jpg" style="margin: 0; width: 100%;" alt="" />
<p style="font-size: 12px; margin: 0;">PikWizard</p>
</a>
</span>
</span>
Free (free of charge)
Free for personal and commercial use.
Author: Awesome Content
Similar Free Stock Images

Premium


Premium

Premium


Premium


Premium


Premium


Premium


Premium


Premium

Premium

Premium


Premium


Premium


Premium


Premium


Premium


Premium


Premium


Premium


Premium

Premium


Premium


Premium


Premium


Premium


Explore More Free Stock Images